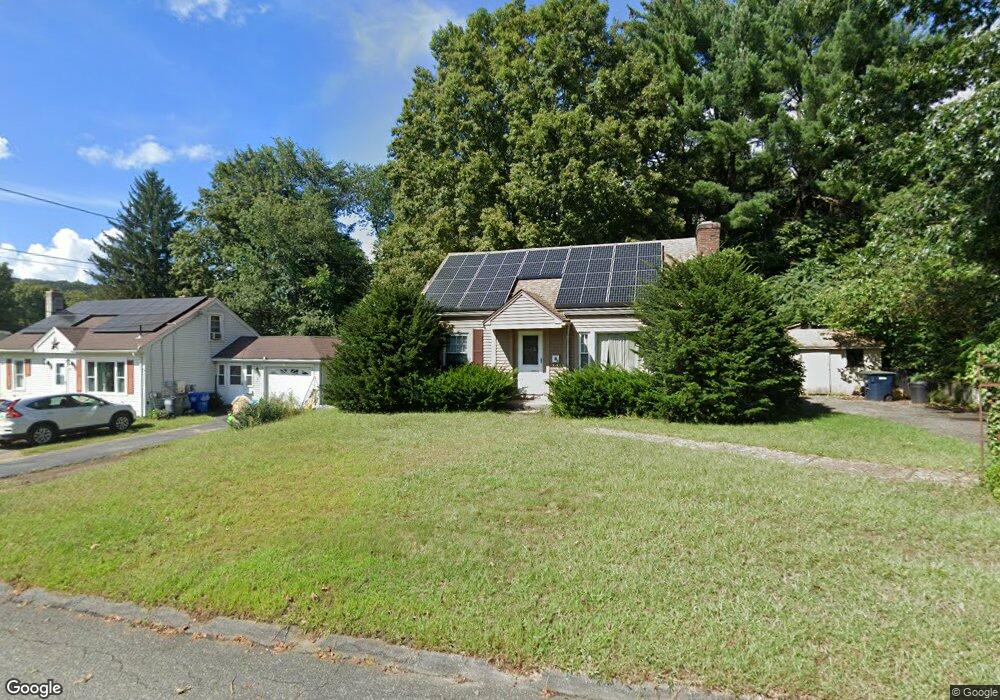
16 Arnold St Palmer, MA 01069
Estimated Value: $272,478 - $323,000
4
Beds
1
Bath
1,069
Sq Ft
$279/Sq Ft
Est. Value
About This Home
This home is located at 16 Arnold St, Palmer, MA 01069 and is currently estimated at $298,120, approximately $278 per square foot. 16 Arnold St is a home located in Hampden County with nearby schools including Old Mill Pond Elementary School, Converse Middle School, and Palmer High School.
Ownership History
Date
Name
Owned For
Owner Type
Purchase Details
Closed on
Jan 14, 2021
Sold by
Woodward Daren W
Bought by
Woodward Daren W and Start Pamela J
Current Estimated Value
Home Financials for this Owner
Home Financials are based on the most recent Mortgage that was taken out on this home.
Original Mortgage
$125,000
Outstanding Balance
$89,145
Interest Rate
2.21%
Mortgage Type
New Conventional
Estimated Equity
$208,975
Purchase Details
Closed on
May 23, 2003
Sold by
Mcadam Donald H and Mcadam Doris E
Bought by
Woodward Daren W
Home Financials for this Owner
Home Financials are based on the most recent Mortgage that was taken out on this home.
Original Mortgage
$116,000
Interest Rate
5.86%
Mortgage Type
Purchase Money Mortgage
Create a Home Valuation Report for This Property
The Home Valuation Report is an in-depth analysis detailing your home's value as well as a comparison with similar homes in the area
Home Values in the Area
Average Home Value in this Area
Purchase History
| Date | Buyer | Sale Price | Title Company |
|---|---|---|---|
| Woodward Daren W | -- | None Available | |
| Woodward Daren W | -- | None Available | |
| Woodward Daren W | $145,000 | -- | |
| Mcadam Donald H | -- | -- | |
| Woodward Daren W | $145,000 | -- | |
| Mcadam Donald H | -- | -- | |
| Mcadam Donald H | -- | -- |
Source: Public Records
Mortgage History
| Date | Status | Borrower | Loan Amount |
|---|---|---|---|
| Open | Woodward Daren W | $125,000 | |
| Closed | Woodward Daren W | $125,000 | |
| Previous Owner | Mcadam Donald H | $116,000 | |
| Previous Owner | Mcadam Donald H | $0 |
Source: Public Records
Tax History
| Year | Tax Paid | Tax Assessment Tax Assessment Total Assessment is a certain percentage of the fair market value that is determined by local assessors to be the total taxable value of land and additions on the property. | Land | Improvement |
|---|---|---|---|---|
| 2025 | $3,630 | $200,000 | $51,900 | $148,100 |
| 2024 | $3,394 | $181,800 | $47,200 | $134,600 |
| 2023 | $3,256 | $167,500 | $47,200 | $120,300 |
| 2022 | $3,094 | $144,600 | $41,400 | $103,200 |
| 2021 | $2,384 | $141,900 | $45,900 | $96,000 |
| 2020 | $3,114 | $136,600 | $45,900 | $90,700 |
| 2019 | $3,024 | $136,600 | $45,900 | $90,700 |
| 2018 | $2,930 | $132,700 | $44,600 | $88,100 |
| 2017 | $2,862 | $132,700 | $44,600 | $88,100 |
| 2016 | $2,742 | $128,900 | $43,300 | $85,600 |
| 2015 | $2,659 | $128,900 | $43,300 | $85,600 |
Source: Public Records
Map
Nearby Homes
- 15 Quaboag Valley Co-Op St Unit 15
- 54-57 Breton and Calkins Rd
- 22 Pine View
- 18 Holbrook St
- 44-50 Lawrence St
- 62-91 Lawrence St
- 1007 Foster St
- 7,37,38 Thorndike and Lawrence St
- 0 St Unit 73414881
- 70 Quaboag Valley Co Op St
- 405 Shearer St
- 204 Bourne St
- 46 Kelley St
- 2173 Main St
- 2151 Main St
- 2166-2168 Main St
- 2022-2024 Prospect St
- 4188 Main St
- 1242 S Main St
- Lot 8 Breckenridge St
Your Personal Tour Guide
Ask me questions while you tour the home.