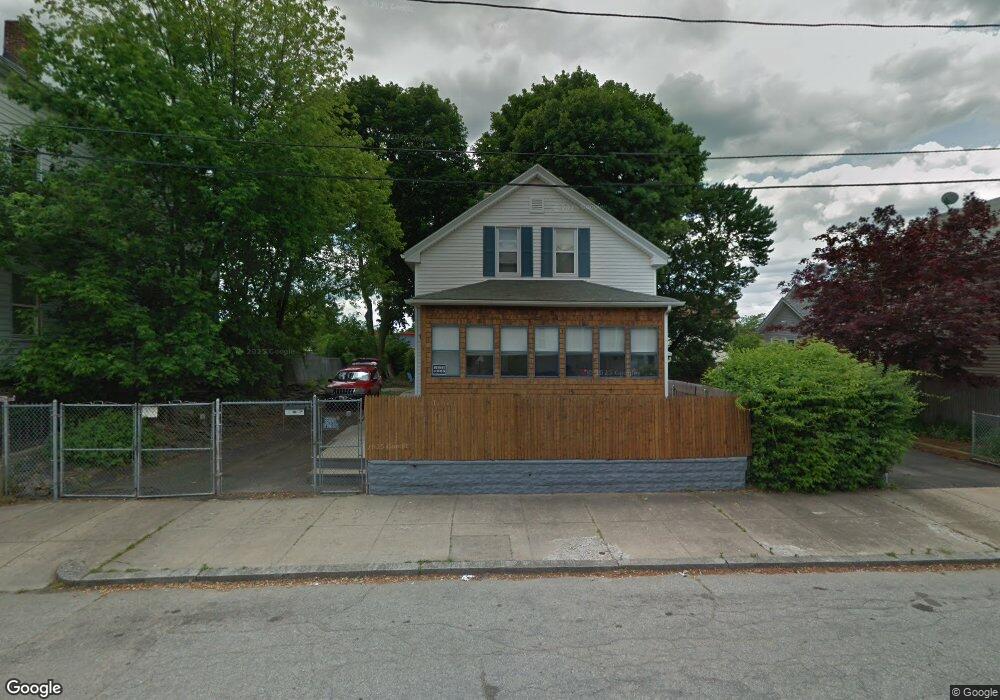
16 Autumn St Providence, RI 02905
Lower South Providence NeighborhoodEstimated Value: $284,000
4
Beds
1
Bath
1,104
Sq Ft
$257/Sq Ft
Est. Value
About This Home
This home is located at 16 Autumn St, Providence, RI 02905 and is currently priced at $284,000, approximately $257 per square foot. 16 Autumn St is a home located in Providence County with nearby schools including Asa Messer Elementary School, Charles N. Fortes Elementary School, and Robert L. Bailey IV Elementary.
Ownership History
Date
Name
Owned For
Owner Type
Purchase Details
Closed on
Mar 24, 2021
Sold by
Gama Michael and Ramos Mary E
Bought by
Fuller Claudette M and Fuller Richard E
Current Estimated Value
Purchase Details
Closed on
Jun 13, 1994
Sold by
Slater Thomas J
Bought by
Gama Michael and Ramos Mary E
Home Financials for this Owner
Home Financials are based on the most recent Mortgage that was taken out on this home.
Original Mortgage
$54,500
Interest Rate
8.29%
Create a Home Valuation Report for This Property
The Home Valuation Report is an in-depth analysis detailing your home's value as well as a comparison with similar homes in the area
Home Values in the Area
Average Home Value in this Area
Purchase History
| Date | Buyer | Sale Price | Title Company |
|---|---|---|---|
| Fuller Claudette M | $50,000 | None Available | |
| Gama Michael | $55,000 | -- |
Source: Public Records
Mortgage History
| Date | Status | Borrower | Loan Amount |
|---|---|---|---|
| Previous Owner | Gama Michael | $54,500 |
Source: Public Records
Tax History Compared to Growth
Tax History
| Year | Tax Paid | Tax Assessment Tax Assessment Total Assessment is a certain percentage of the fair market value that is determined by local assessors to be the total taxable value of land and additions on the property. | Land | Improvement |
|---|---|---|---|---|
| 2021 | $1,988 | $134,900 | $38,700 | $96,200 |
| 2020 | $1,988 | $134,900 | $38,700 | $96,200 |
| 2019 | $3,313 | $134,900 | $38,700 | $96,200 |
| 2018 | $3,564 | $111,500 | $35,200 | $76,300 |
| 2017 | $3,564 | $111,500 | $35,200 | $76,300 |
| 2016 | $3,564 | $111,500 | $35,200 | $76,300 |
| 2015 | $3,588 | $108,400 | $35,200 | $73,200 |
| 2014 | $3,659 | $108,400 | $35,200 | $73,200 |
| 2013 | $3,659 | $108,400 | $35,200 | $73,200 |
Source: Public Records
Map
Nearby Homes