
Seller's Agent in 2025
Xiaoyi Wu
QUEENSTON REALTY
(609) 375-5677
6 in this area
202 Total Sales
Estimated Value: $623,686 - $713,000
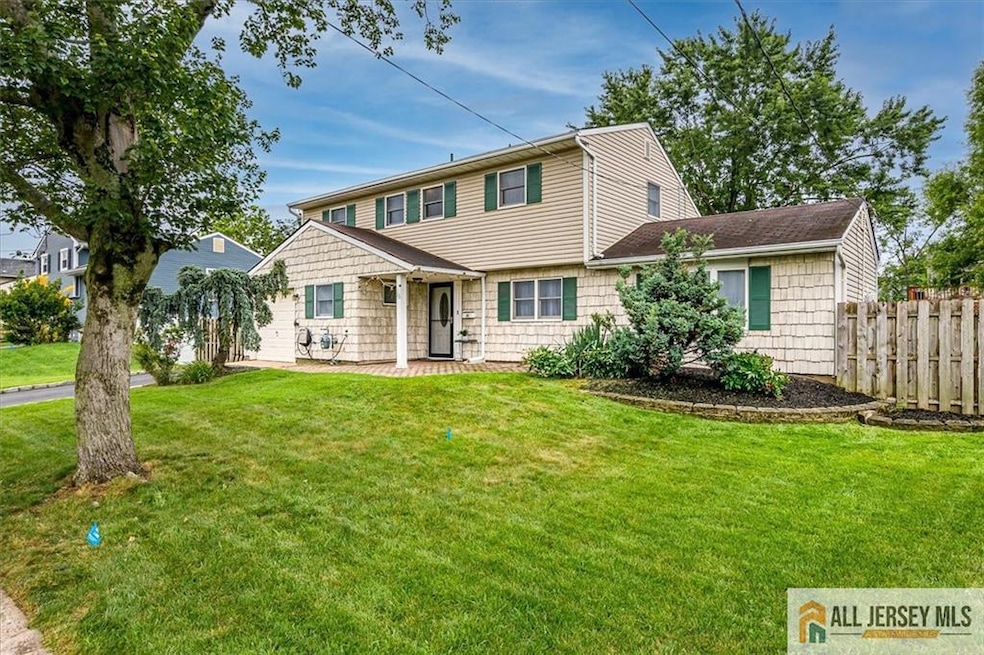
Tired of circling for parking at H-Mart? What if you lived just minutes away instead? Located just 0.7 miles from H-Mart and its popular food court restaurants, this north-facing, move-in ready split-level offers unbeatable convenience: you're also only 0.6 miles from the NYC train station, 0.3 miles from the elementary school, and 0.6 miles from the middle school and the Edison Public Library. Grocery runs, school drop-offs, commuting, and weekend reading time have never been easier. Fully renovated in 2015, this home features 4 bedrooms and 2 full baths, including a main level bedroom and full bath - perfect for guests, multi-generational living, or a private home office. The sunny living room boasts vaulted ceilings, and the kitchen is updated with granite countertops and stainless steel appliances. Major system upgrades include a 4-year-old HVAC, an 8-year-old water heater, and fully owned solar panels installed in 2020 to keep energy costs in check. Out back, relax under your own grapevine-covered arbor - ideal for outdoor dining, lazy weekends, or just soaking up the shade. Homes that offer this level of comfort, location, and value don't come around often. Come take a look - and maybe leave your car parked for good.
| Date | Buyer | Sale Price | Title Company |
|---|---|---|---|
| Han Yieh John Yueh | $655,000 | North Star Title Agency | |
| Han Yieh John Yueh | $655,000 | North Star Title Agency | |
| Su Ni | $362,000 | Title Resources Guaranty Com | |
| Teeslovic Viktor | $207,000 | Multiple | |
| Kivenson Ilya | $227,000 | -- | |
| Duhigg Joseph | $155,000 | -- |
| Date | Status | Borrower | Loan Amount |
|---|---|---|---|
| Open | Han Yieh John Yueh | $400,000 | |
| Closed | Han Yieh John Yueh | $400,000 | |
| Previous Owner | Kivenson Ilya | $174,400 | |
| Previous Owner | Duhigg Joseph | $132,000 |
| Date | Event | Price | List to Sale | Price per Sq Ft |
|---|---|---|---|---|
| 08/29/2025 08/29/25 | Sold | $655,000 | +5.6% | $404 / Sq Ft |
| 07/18/2025 07/18/25 | For Sale | $620,000 | -- | $382 / Sq Ft |
| Year | Tax Paid | Tax Assessment Tax Assessment Total Assessment is a certain percentage of the fair market value that is determined by local assessors to be the total taxable value of land and additions on the property. | Land | Improvement |
|---|---|---|---|---|
| 2025 | $9,602 | $161,300 | $95,600 | $65,700 |
| 2024 | $9,551 | $161,300 | $95,600 | $65,700 |
| 2023 | $9,551 | $161,300 | $95,600 | $65,700 |
| 2022 | $9,554 | $161,300 | $95,600 | $65,700 |
| 2021 | $9,522 | $161,300 | $95,600 | $65,700 |
| 2020 | $9,434 | $161,300 | $95,600 | $65,700 |
| 2019 | $8,904 | $161,300 | $95,600 | $65,700 |
| 2018 | $8,748 | $161,300 | $95,600 | $65,700 |
| 2017 | $8,667 | $161,300 | $95,600 | $65,700 |
| 2016 | $8,510 | $161,300 | $95,600 | $65,700 |
| 2015 | $8,184 | $161,300 | $95,600 | $65,700 |
| 2014 | $7,946 | $161,300 | $95,600 | $65,700 |
Seller's Agent in 2025
Xiaoyi Wu
QUEENSTON REALTY
(609) 375-5677
6 in this area
202 Total Sales
Source: All Jersey MLS
MLS Number: 2660101M
APN: 05-00082-10-00016
Disclaimer: Certain information contained herein is derived from information provided by parties other than Homes.com. All information provided is deemed reliable, but is not guaranteed to be accurate and should be independently verified.
![]() The data relating to real estate for sale on this web-site comes in part from the Internet Listing Display database of the CENTRAL JERSEY MULTIPLE LISTING SYSTEM, INC. Real estate listings held by brokerage firms other than this site-owner are marked with the ILD logo. The CENTRAL JERSEY MULTIPLE LISTING SYSTEM, INC does not warrant the accuracy, quality, reliability, suitability, completeness, usefulness or effectiveness of any information provided.
The data relating to real estate for sale on this web-site comes in part from the Internet Listing Display database of the CENTRAL JERSEY MULTIPLE LISTING SYSTEM, INC. Real estate listings held by brokerage firms other than this site-owner are marked with the ILD logo. The CENTRAL JERSEY MULTIPLE LISTING SYSTEM, INC does not warrant the accuracy, quality, reliability, suitability, completeness, usefulness or effectiveness of any information provided.
Copyright 2026, CENTRAL JERSEY MULTIPLE LISTING SYSTEM, INC All rights reserved
The CENTRAL JERSEY MULTIPLE LISTING SYSTEM, INC retains all rights, title and interest in and to its trademarks, service marks and copyrighted material.
The information being provided is for consumers' personal, non-commercial use and may not be used for any purpose other than to identify properties the consumer may be interested in purchasing or renting.
Ask me questions while you tour the home.