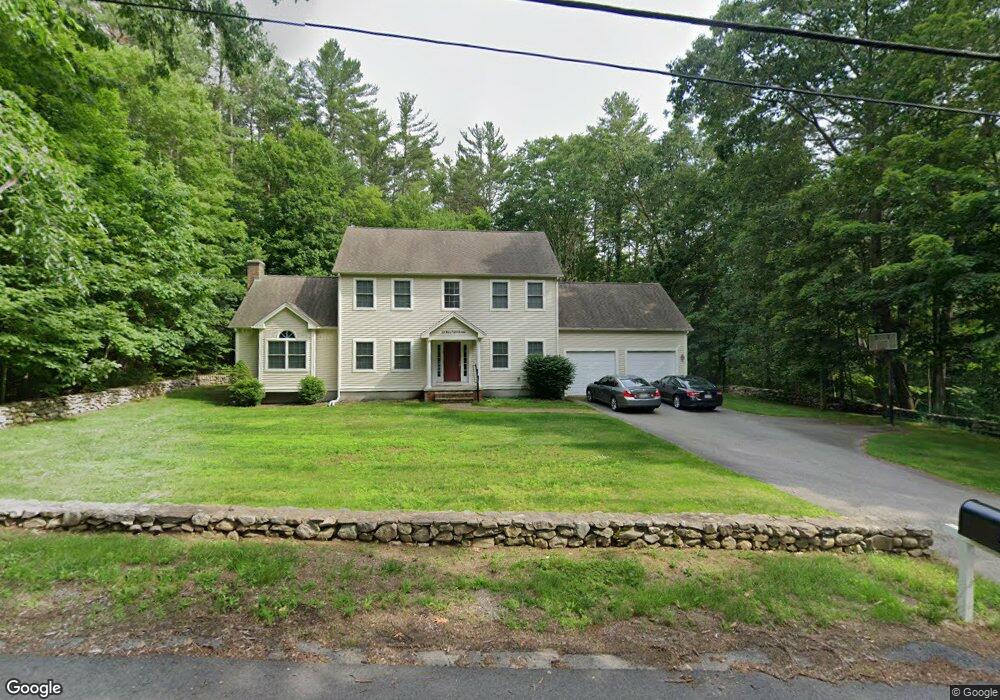
16 Bay Path Rd Charlton, MA 01507
Estimated Value: $576,000 - $671,000
3
Beds
3
Baths
2,272
Sq Ft
$271/Sq Ft
Est. Value
About This Home
This home is located at 16 Bay Path Rd, Charlton, MA 01507 and is currently estimated at $616,808, approximately $271 per square foot. 16 Bay Path Rd is a home located in Worcester County with nearby schools including Shepherd Hill Regional High School.
Ownership History
Date
Name
Owned For
Owner Type
Purchase Details
Closed on
Oct 20, 2004
Sold by
Tetreau James L and Tetreau Roxann C
Bought by
Cederman Amanda and Cederman Paul E
Current Estimated Value
Home Financials for this Owner
Home Financials are based on the most recent Mortgage that was taken out on this home.
Original Mortgage
$125,000
Interest Rate
5.85%
Mortgage Type
Purchase Money Mortgage
Purchase Details
Closed on
Aug 26, 2003
Sold by
Hammond Richard A and Hammond Tracie M
Bought by
Tetreau James L and Tetreau Roxann C
Purchase Details
Closed on
Aug 6, 2002
Sold by
Darling Richard A
Bought by
Hammond Richard A and Hammond Tracie M
Home Financials for this Owner
Home Financials are based on the most recent Mortgage that was taken out on this home.
Original Mortgage
$52,000
Interest Rate
6.64%
Mortgage Type
Purchase Money Mortgage
Create a Home Valuation Report for This Property
The Home Valuation Report is an in-depth analysis detailing your home's value as well as a comparison with similar homes in the area
Home Values in the Area
Average Home Value in this Area
Purchase History
| Date | Buyer | Sale Price | Title Company |
|---|---|---|---|
| Cederman Amanda | $402,000 | -- | |
| Cederman Amanda | $402,000 | -- | |
| Tetreau James L | $85,000 | -- | |
| Tetreau James L | $85,000 | -- | |
| Hammond Richard A | $65,000 | -- |
Source: Public Records
Mortgage History
| Date | Status | Borrower | Loan Amount |
|---|---|---|---|
| Open | Hammond Richard A | $251,500 | |
| Closed | Hammond Richard A | $221,000 | |
| Closed | Cederman Amanda | $125,000 | |
| Previous Owner | Hammond Richard A | $52,000 |
Source: Public Records
Tax History
| Year | Tax Paid | Tax Assessment Tax Assessment Total Assessment is a certain percentage of the fair market value that is determined by local assessors to be the total taxable value of land and additions on the property. | Land | Improvement |
|---|---|---|---|---|
| 2025 | $5,644 | $507,100 | $85,900 | $421,200 |
| 2024 | $5,459 | $481,400 | $82,700 | $398,700 |
| 2023 | $5,310 | $436,300 | $78,300 | $358,000 |
| 2022 | $5,640 | $424,400 | $76,600 | $347,800 |
| 2021 | $5,558 | $370,300 | $74,800 | $295,500 |
| 2020 | $5,447 | $364,600 | $68,800 | $295,800 |
| 2019 | $5,385 | $364,600 | $68,800 | $295,800 |
| 2018 | $4,922 | $364,600 | $68,800 | $295,800 |
| 2017 | $4,702 | $333,500 | $62,800 | $270,700 |
| 2016 | $4,596 | $333,500 | $62,800 | $270,700 |
| 2015 | $4,476 | $333,500 | $62,800 | $270,700 |
| 2014 | $4,313 | $340,700 | $67,100 | $273,600 |
Source: Public Records
Map
Nearby Homes
- 0 Oxbow Rd
- 0 Hammond Hill Rd
- 40 Carroll Hill Rd
- Lot 8 Coughlin Rd
- 8 Hycrest Rd
- 7 Hycrest Rd
- 8 Wamsutta Ridge Rd
- 31-37 Leicester St
- 45 Leicester St
- 164 Oxford Rd
- 707 Main St
- 8 Northside Rd
- 4 Thayer Pond Dr Unit 20
- 6 Thayer Pond Dr Unit 11
- 32 Thayer Pond Dr Unit 11
- 34 Thayer Pond Dr Unit 8
- 28 Thayer Pond Dr Unit 14
- 24 Thayer Pond Dr Unit 17
- 17 Thayer Pond Dr Unit 2
- 19 Thayer Pond Dr Unit 3
- 18 Bay Path Rd
- 22 Bay Path Rd
- 7 Bay Path Rd
- 6 Bay Path Rd
- 21 Bay Path Rd
- 28 Bay Path Rd
- 406C Worcester Rd
- 406 Worcester Rd Unit A
- 406 Worcester Rd
- 406B Worcester Rd
- 9 Richardson Corner Rd
- 2 Bay Path Rd
- 30 Bay Path Rd
- Lot II Richardson's Corner Path
- 25 Richardson Corner Rd
- 14 Bay Path Rd
- 14A Bay Path Rd
- 14B Bay Path Rd
- 21 Richardson Corner Rd
- 3 Richardson Corner Rd
Your Personal Tour Guide
Ask me questions while you tour the home.