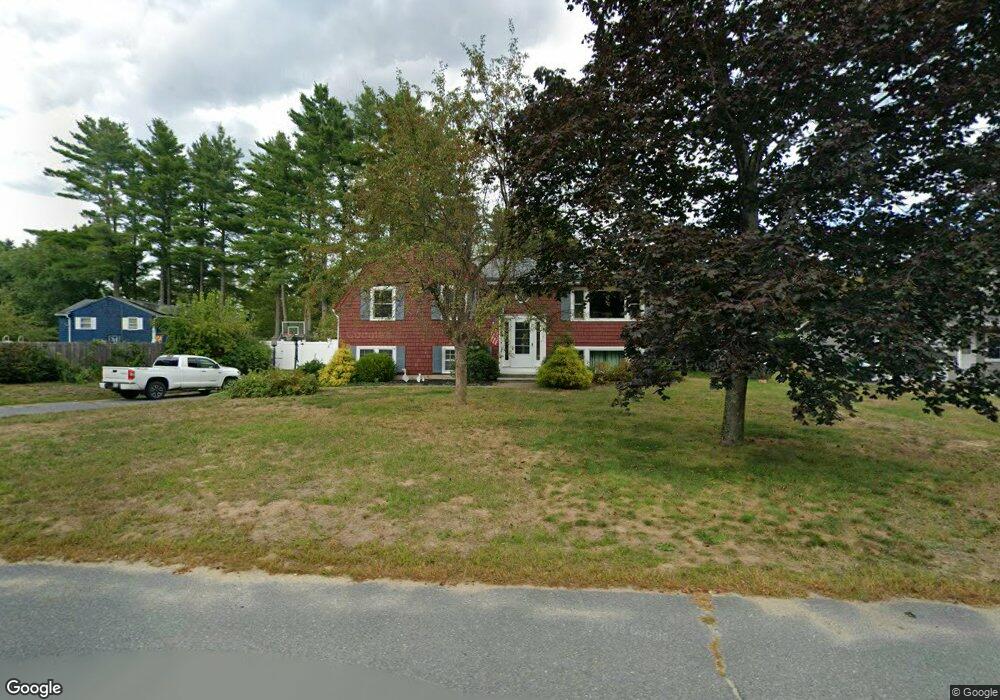
16 Beech St Townsend, MA 01469
Estimated Value: $452,000 - $492,799
About This Home
This home is located at 16 Beech St, Townsend, MA 01469 and is currently estimated at $471,700, approximately $290 per square foot. 16 Beech St is a home located in Middlesex County with nearby schools including North Middlesex Regional High School.
Ownership History
We collect this data history from publicly available records. To have your information removed, we recommend requesting removal directly through your county’s website.
Purchase Details
Home Financials for this Owner
Home Financials are based on the most recent Mortgage that was taken out on this home.Purchase Details
Home Values in the Area
Average Home Value in this Area
Purchase History
We collect this data history from publicly available records. To have your information removed, we recommend requesting removal directly through your county’s website.
| Date | Buyer | Sale Price | Title Company |
|---|---|---|---|
| $280,000 | -- | ||
| $48,000 | -- |
Mortgage History
We collect this data history from publicly available records. To have your information removed, we recommend requesting removal directly through your county’s website.
| Date | Status | Borrower | Loan Amount |
|---|---|---|---|
| Open | $244,444 | ||
| Previous Owner | $55,000 | ||
| Previous Owner | $75,000 | ||
| Previous Owner | $20,000 |
Tax History
We collect this data history from publicly available records. To have your information removed, we recommend requesting removal directly through your county’s website.
| Year | Tax Paid | Tax Assessment Tax Assessment Total Assessment is a certain percentage of the fair market value that is determined by local assessors to be the total taxable value of land and additions on the property. | Land | Improvement |
|---|---|---|---|---|
| 2025 | $5,690 | $391,900 | $90,700 | $301,200 |
| 2024 | $5,538 | $384,300 | $90,700 | $293,600 |
| 2023 | $5,088 | $333,400 | $78,300 | $255,100 |
| 2022 | $5,301 | $301,000 | $71,700 | $229,300 |
| 2021 | $5,037 | $274,800 | $70,900 | $203,900 |
| 2020 | $5,026 | $257,500 | $64,300 | $193,200 |
| 2019 | $4,713 | $243,800 | $64,300 | $179,500 |
| 2018 | $4,500 | $222,100 | $57,700 | $164,400 |
| 2017 | $4,259 | $216,500 | $60,600 | $155,900 |
| 2016 | $4,071 | $205,600 | $60,600 | $145,000 |
| 2015 | $3,812 | $199,500 | $67,200 | $132,300 |
| 2014 | $3,575 | $182,700 | $63,000 | $119,700 |
Map
- 6 Redwood St
- 100 S Harbor Rd
- 25 Hickory Dr
- 8 South St
- 103 Warren Rd
- 122 S Row Rd
- 29 Ponderosa Dr
- 105 Main St
- Lot 10 Christian Cir
- 1 Kayla Ln
- 46 West St
- 211 Main St
- 1 Depot Street Extension Unit 1
- 1 Depot Street Extension Unit 4
- 203 Wallace Hill Rd
- 55 Beachview Rd
- 40 Shattuck St Unit 42
- 79 Tyler Rd
- 39 Hog Hill Rd
- 65 S Row Rd
Ask me questions while you tour the home.