Estimated Value: $726,386 - $766,000
3
Beds
2
Baths
1,775
Sq Ft
$418/Sq Ft
Est. Value
About This Home
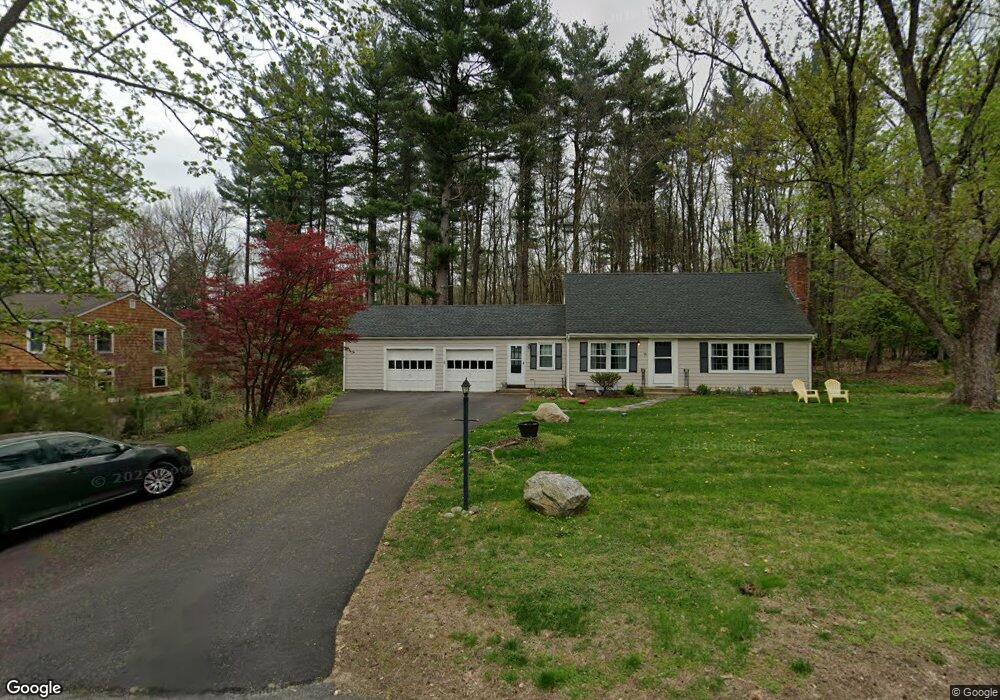
This home is located at 16 Beverly Rd Unit 16, Acton, MA 01720 and is currently estimated at $741,347, approximately $417 per square foot. 16 Beverly Rd Unit 16 is a home located in Middlesex County with nearby schools including Acton-Boxborough Regional High School, Maynard Knowledge Beginnings, and The Imago School.
Ownership History
Date
Name
Owned For
Owner Type
Purchase Details
Closed on
May 25, 2017
Sold by
Blanco Mario A and Blanco Linda C
Bought by
Dawn Kurt D and Dawn Lisa R
Current Estimated Value
Home Financials for this Owner
Home Financials are based on the most recent Mortgage that was taken out on this home.
Original Mortgage
$441,849
Outstanding Balance
$367,217
Interest Rate
4.25%
Mortgage Type
FHA
Estimated Equity
$374,130
Purchase Details
Closed on
Oct 6, 1978
Bought by
Blanco Mario A
Create a Home Valuation Report for This Property
The Home Valuation Report is an in-depth analysis detailing your home's value as well as a comparison with similar homes in the area
Home Values in the Area
Average Home Value in this Area
Purchase History
| Date | Buyer | Sale Price | Title Company |
|---|---|---|---|
| Dawn Kurt D | $450,000 | -- | |
| Blanco Mario A | -- | -- |
Source: Public Records
Mortgage History
| Date | Status | Borrower | Loan Amount |
|---|---|---|---|
| Open | Dawn Kurt D | $441,849 | |
| Previous Owner | Blanco Mario A | $157,600 | |
| Previous Owner | Blanco Mario A | $172,500 |
Source: Public Records
Tax History
| Year | Tax Paid | Tax Assessment Tax Assessment Total Assessment is a certain percentage of the fair market value that is determined by local assessors to be the total taxable value of land and additions on the property. | Land | Improvement |
|---|---|---|---|---|
| 2025 | $11,089 | $646,600 | $315,800 | $330,800 |
| 2024 | $10,499 | $629,800 | $315,800 | $314,000 |
| 2023 | $10,552 | $600,900 | $286,900 | $314,000 |
| 2022 | $9,589 | $493,000 | $249,500 | $243,500 |
| 2021 | $9,409 | $465,100 | $231,200 | $233,900 |
| 2020 | $8,675 | $450,900 | $231,200 | $219,700 |
| 2019 | $8,310 | $429,000 | $231,200 | $197,800 |
| 2018 | $8,182 | $422,200 | $231,200 | $191,000 |
| 2017 | $8,047 | $422,200 | $231,200 | $191,000 |
| 2016 | $7,692 | $400,000 | $231,200 | $168,800 |
| 2015 | $7,721 | $405,300 | $231,200 | $174,100 |
| 2014 | $7,576 | $389,500 | $231,200 | $158,300 |
Source: Public Records
Map
Nearby Homes
Your Personal Tour Guide
Ask me questions while you tour the home.