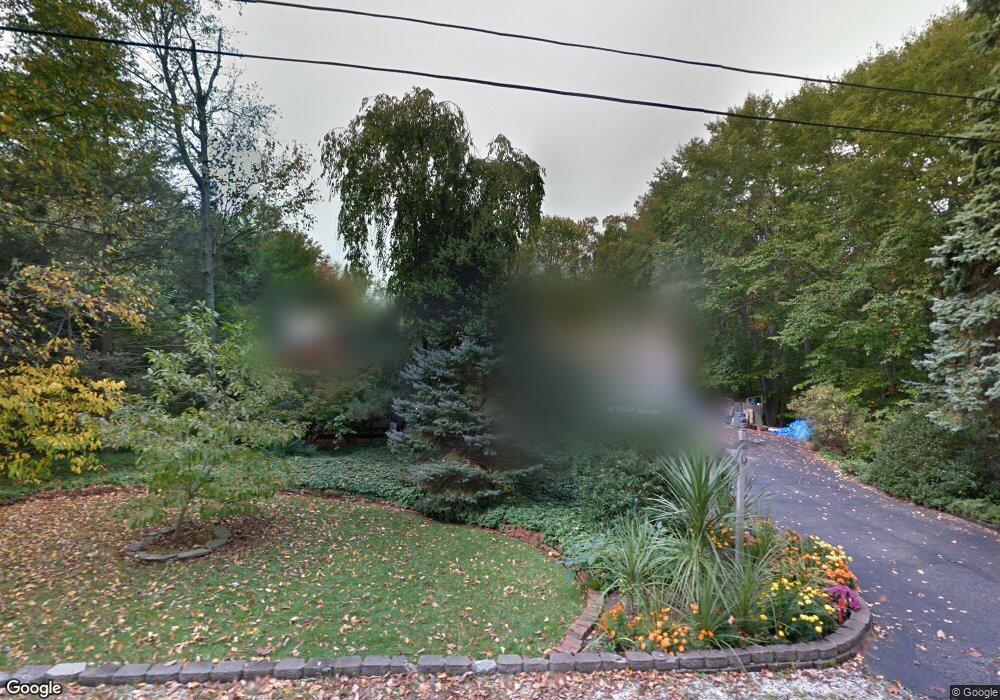
16 Birch Rd Kinnelon, NJ 07405
Estimated Value: $591,800 - $683,000
--
Bed
--
Bath
1,388
Sq Ft
$453/Sq Ft
Est. Value
About This Home
This home is located at 16 Birch Rd, Kinnelon, NJ 07405 and is currently estimated at $628,950, approximately $453 per square foot. 16 Birch Rd is a home located in Morris County with nearby schools including Kiel School, Stonybrook School, and Pearl R. Miller Middle School.
Ownership History
Date
Name
Owned For
Owner Type
Purchase Details
Closed on
May 29, 2012
Sold by
Angermund Eva and Angermund Steven H
Bought by
Angermund Steven H
Current Estimated Value
Purchase Details
Closed on
Sep 30, 2004
Sold by
Fichtler Hans
Bought by
Angermound Steven and Angermund Eva
Home Financials for this Owner
Home Financials are based on the most recent Mortgage that was taken out on this home.
Original Mortgage
$333,000
Interest Rate
5.75%
Create a Home Valuation Report for This Property
The Home Valuation Report is an in-depth analysis detailing your home's value as well as a comparison with similar homes in the area
Home Values in the Area
Average Home Value in this Area
Purchase History
| Date | Buyer | Sale Price | Title Company |
|---|---|---|---|
| Angermund Steven H | -- | None Available | |
| Angermound Steven | $470,000 | -- |
Source: Public Records
Mortgage History
| Date | Status | Borrower | Loan Amount |
|---|---|---|---|
| Previous Owner | Angermound Steven | $333,000 |
Source: Public Records
Tax History Compared to Growth
Tax History
| Year | Tax Paid | Tax Assessment Tax Assessment Total Assessment is a certain percentage of the fair market value that is determined by local assessors to be the total taxable value of land and additions on the property. | Land | Improvement |
|---|---|---|---|---|
| 2025 | $11,646 | $402,000 | $225,000 | $177,000 |
| 2024 | $11,405 | $402,000 | $225,000 | $177,000 |
| 2023 | $11,405 | $402,000 | $225,000 | $177,000 |
| 2022 | $10,842 | $402,000 | $225,000 | $177,000 |
| 2021 | $10,842 | $402,000 | $225,000 | $177,000 |
| 2020 | $10,641 | $402,000 | $225,000 | $177,000 |
| 2019 | $10,396 | $402,000 | $225,000 | $177,000 |
| 2018 | $10,183 | $402,000 | $225,000 | $177,000 |
| 2017 | $10,010 | $402,000 | $225,000 | $177,000 |
| 2016 | $9,041 | $278,100 | $139,000 | $139,100 |
| 2015 | $8,682 | $278,100 | $139,000 | $139,100 |
| 2014 | $8,535 | $278,100 | $139,000 | $139,100 |
Source: Public Records
Map
Nearby Homes