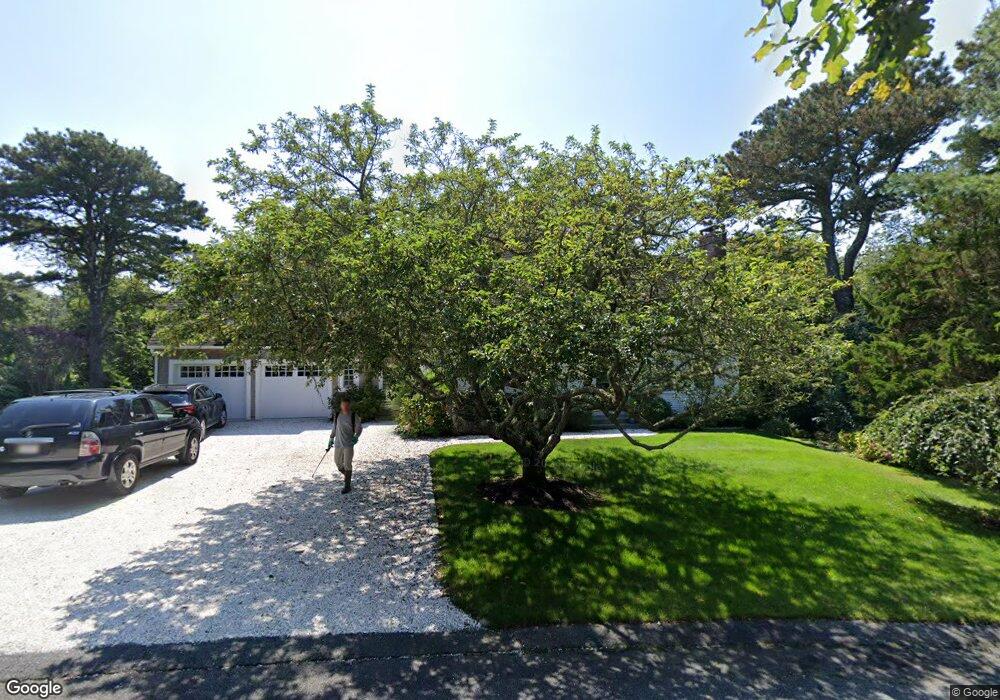
16 Black Duck Landing Chatham, MA 02633
Chatham Village NeighborhoodEstimated Value: $2,424,000 - $2,751,000
3
Beds
3
Baths
1,501
Sq Ft
$1,697/Sq Ft
Est. Value
About This Home
This home is located at 16 Black Duck Landing, Chatham, MA 02633 and is currently estimated at $2,547,098, approximately $1,696 per square foot. 16 Black Duck Landing is a home located in Barnstable County with nearby schools including Chatham Elementary School, Harwich Elementary School, and Monomoy Regional Middle School.
Ownership History
Date
Name
Owned For
Owner Type
Purchase Details
Closed on
Jul 14, 2016
Sold by
Silvestri Vincent E and Longo-Silvestri Joann M
Bought by
Vincent E Silverstri R
Current Estimated Value
Purchase Details
Closed on
Jun 25, 2004
Sold by
Adelaide H Mortensen F and Mortensen Adelaide H
Bought by
Longo-Silvestri Joann M and Silvestri Vincent E
Home Financials for this Owner
Home Financials are based on the most recent Mortgage that was taken out on this home.
Original Mortgage
$544,000
Interest Rate
6.32%
Mortgage Type
Purchase Money Mortgage
Create a Home Valuation Report for This Property
The Home Valuation Report is an in-depth analysis detailing your home's value as well as a comparison with similar homes in the area
Home Values in the Area
Average Home Value in this Area
Purchase History
| Date | Buyer | Sale Price | Title Company |
|---|---|---|---|
| Vincent E Silverstri R | -- | -- | |
| Longo-Silvestri Joann M | $679,600 | -- |
Source: Public Records
Mortgage History
| Date | Status | Borrower | Loan Amount |
|---|---|---|---|
| Previous Owner | Longo-Silvestri Joann M | $544,000 |
Source: Public Records
Tax History Compared to Growth
Tax History
| Year | Tax Paid | Tax Assessment Tax Assessment Total Assessment is a certain percentage of the fair market value that is determined by local assessors to be the total taxable value of land and additions on the property. | Land | Improvement |
|---|---|---|---|---|
| 2025 | $8,223 | $2,369,700 | $1,374,200 | $995,500 |
| 2024 | $7,940 | $2,224,100 | $1,296,600 | $927,500 |
| 2023 | $7,203 | $1,856,500 | $1,080,400 | $776,100 |
| 2022 | $7,402 | $1,602,200 | $1,080,400 | $521,800 |
| 2021 | $6,931 | $1,391,700 | $916,400 | $475,300 |
| 2020 | $6,260 | $1,298,700 | $835,300 | $463,400 |
| 2019 | $5,641 | $1,163,000 | $781,100 | $381,900 |
| 2018 | $5,513 | $1,132,100 | $781,100 | $351,000 |
| 2017 | $5,197 | $1,033,300 | $758,200 | $275,100 |
| 2016 | $5,294 | $1,054,500 | $781,600 | $272,900 |
| 2015 | $5,127 | $1,027,400 | $759,300 | $268,100 |
| 2014 | $5,215 | $1,026,500 | $759,300 | $267,200 |
Source: Public Records
Map
Nearby Homes
- 287 Cedar St
- 85 Cedar St
- 404 Stage Harbor Rd
- 292 Stage Harbor Rd
- 86 Champlain Rd
- 99 Uncle Alberts Drive Extension
- 58 Oyster Bluff
- 12 Pond St
- 745 Main St
- 14 Pond View Ln
- 36 Moonbeam Ln
- 346 Morris Island Rd
- 450 Main St
- 425 Main St Unit D
- 425 Main St Unit D
- 409 Main St
- 32 Sunset Ln
- 3 Oyster Dr
- 144 Barn Hill Rd
- 29 Jessies Landing
- 30 Black Duck Landing
- 7 Black Duck Landing
- 213 Cedar St
- 42 Black Duck Landing
- 35 Black Duck Landing
- 226 Cedar St
- 207 Cedar St
- 267 Cedar St
- 17 Cedar St
- 0 Cedar St L:17d Unit 73056096
- 0 Cedar St L:17d Unit 72813073
- 195 Cedar St
- 208 Cedar St
- 30 Taylor Ln
- 56 Black Duck Landing
- 274 Cedar St
- 49 Black Duck Landing
- 189 Cedar St
- 41 Taylor Ln
- 198 Cedar St