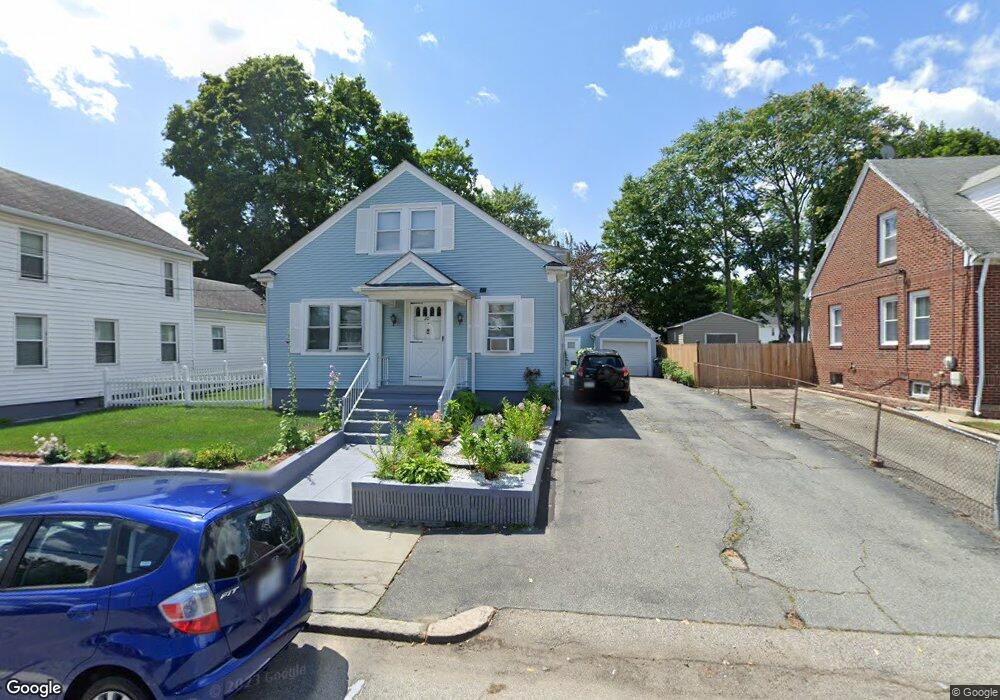
16 Bowlet St Providence, RI 02909
Hartford NeighborhoodEstimated Value: $434,815 - $515,000
5
Beds
2
Baths
1,700
Sq Ft
$278/Sq Ft
Est. Value
About This Home
This home is located at 16 Bowlet St, Providence, RI 02909 and is currently estimated at $472,954, approximately $278 per square foot. 16 Bowlet St is a home located in Providence County with nearby schools including Achievement First Promesa, Achievement First Providence Mayoral Academy Elementary School, and Achievement First Providence Mayoral Academy Elementary.
Ownership History
Date
Name
Owned For
Owner Type
Purchase Details
Closed on
Nov 17, 1993
Sold by
Leonardo Joseph T and Simas Marie J
Bought by
Rodriguez Arteliza M
Current Estimated Value
Home Financials for this Owner
Home Financials are based on the most recent Mortgage that was taken out on this home.
Original Mortgage
$92,950
Interest Rate
6.77%
Mortgage Type
Purchase Money Mortgage
Create a Home Valuation Report for This Property
The Home Valuation Report is an in-depth analysis detailing your home's value as well as a comparison with similar homes in the area
Home Values in the Area
Average Home Value in this Area
Purchase History
| Date | Buyer | Sale Price | Title Company |
|---|---|---|---|
| Rodriguez Arteliza M | $98,000 | -- |
Source: Public Records
Mortgage History
| Date | Status | Borrower | Loan Amount |
|---|---|---|---|
| Closed | Rodriguez Arteliza M | $89,610 | |
| Closed | Rodriguez Arteliza M | $92,950 |
Source: Public Records
Tax History
| Year | Tax Paid | Tax Assessment Tax Assessment Total Assessment is a certain percentage of the fair market value that is determined by local assessors to be the total taxable value of land and additions on the property. | Land | Improvement |
|---|---|---|---|---|
| 2025 | $3,132 | $414,800 | $140,700 | $274,100 |
| 2024 | $5,158 | $281,100 | $89,000 | $192,100 |
| 2023 | $5,158 | $281,100 | $89,000 | $192,100 |
| 2022 | $5,004 | $281,100 | $89,000 | $192,100 |
| 2021 | $4,129 | $168,100 | $53,900 | $114,200 |
| 2020 | $4,129 | $168,100 | $53,900 | $114,200 |
| 2019 | $4,129 | $168,100 | $53,900 | $114,200 |
| 2018 | $3,960 | $123,900 | $46,000 | $77,900 |
| 2017 | $3,960 | $123,900 | $46,000 | $77,900 |
| 2016 | $3,960 | $123,900 | $46,000 | $77,900 |
| 2015 | $3,406 | $102,900 | $46,000 | $56,900 |
| 2014 | $3,473 | $102,900 | $46,000 | $56,900 |
| 2013 | $3,473 | $102,900 | $46,000 | $56,900 |
Source: Public Records
Map
Nearby Homes
- 15 Melissa St
- 102 Ophelia St
- 129 Glenbridge Ave
- 162 Merino St
- 60 Ophelia St
- 29 Matson Ave Unit 4D
- 18 Crowninshield St
- 17 Middleton St
- 236 Lowell Ave
- 231 Lowell Ave
- 30 Edgemere Ave
- 240 Eastwood Ave
- 10 Mott St
- 140 Cleveland St
- 27 Aurelia Dr
- 0 Central Ave Unit 1398155
- 839 Manton Ave
- 665 Plainfield St
- 20 Brush Hill Rd
- 0 Orchard St Unit 1396400
- 20 Bowlet St
- 21 Hilarity St
- 11 Hilarity St
- 23 Hilarity St
- 555 Hartford Ave
- 32 Bowlet St
- 17 Bowlet St
- 9 Bowlet St
- 7 Hilarity St
- 553 Hartford Ave
- 25 Hilarity St
- 27 Hilarity St
- 181 Glenbridge Ave
- 14 Hilarity St
- 189 Glenbridge Ave
- 185 Glenbridge Ave
- 22 Hilarity St
- 10 Hilarity St
- 35 Bowlet St
- 195 Glenbridge Ave
Your Personal Tour Guide
Ask me questions while you tour the home.