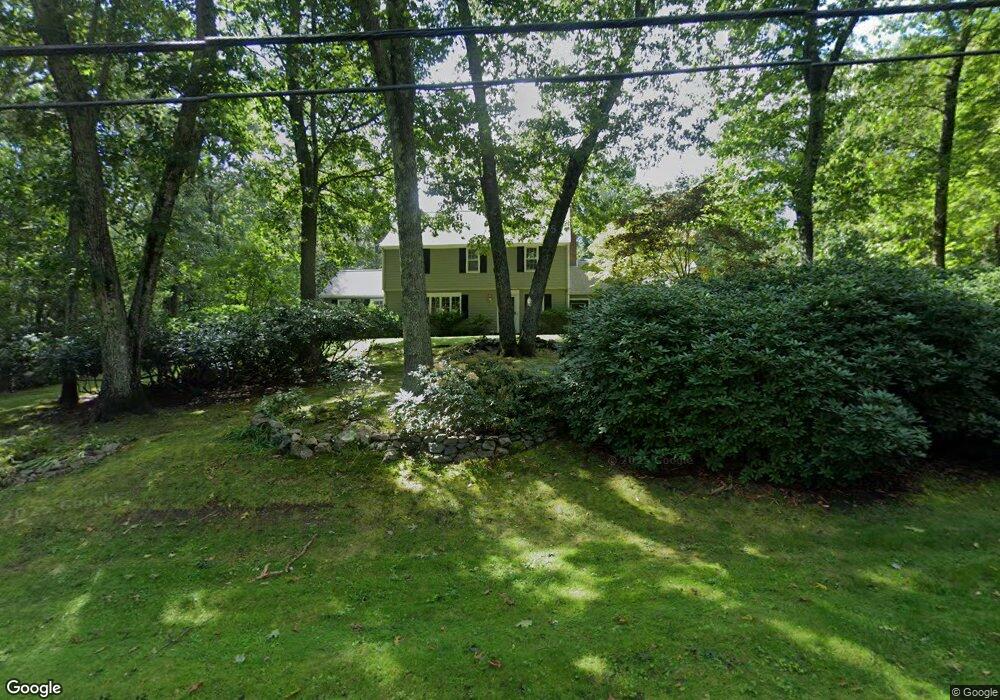
16 Bridle Path Sherborn, MA 01770
Estimated Value: $1,102,467 - $1,478,000
4
Beds
3
Baths
2,699
Sq Ft
$456/Sq Ft
Est. Value
About This Home
This home is located at 16 Bridle Path, Sherborn, MA 01770 and is currently estimated at $1,231,117, approximately $456 per square foot. 16 Bridle Path is a home located in Middlesex County with nearby schools including Pine Hill Elementary School, Dover-Sherborn Regional Middle School, and Dover-Sherborn Regional High School.
Ownership History
Date
Name
Owned For
Owner Type
Purchase Details
Closed on
Nov 9, 1987
Sold by
Blackburn Donald B
Bought by
Howe James H
Current Estimated Value
Home Financials for this Owner
Home Financials are based on the most recent Mortgage that was taken out on this home.
Original Mortgage
$50,000
Interest Rate
10.67%
Create a Home Valuation Report for This Property
The Home Valuation Report is an in-depth analysis detailing your home's value as well as a comparison with similar homes in the area
Home Values in the Area
Average Home Value in this Area
Purchase History
| Date | Buyer | Sale Price | Title Company |
|---|---|---|---|
| Howe James H | $280,000 | -- |
Source: Public Records
Mortgage History
| Date | Status | Borrower | Loan Amount |
|---|---|---|---|
| Open | Howe James H | $110,000 | |
| Open | Howe James H | $178,000 | |
| Closed | Howe James H | $75,000 | |
| Closed | Howe James H | $50,000 |
Source: Public Records
Tax History
| Year | Tax Paid | Tax Assessment Tax Assessment Total Assessment is a certain percentage of the fair market value that is determined by local assessors to be the total taxable value of land and additions on the property. | Land | Improvement |
|---|---|---|---|---|
| 2025 | $17,263 | $1,041,200 | $454,200 | $587,000 |
| 2024 | $16,308 | $962,100 | $454,200 | $507,900 |
| 2023 | $15,082 | $837,400 | $454,200 | $383,200 |
| 2022 | $13,966 | $733,900 | $443,900 | $290,000 |
| 2021 | $13,898 | $708,000 | $443,900 | $264,100 |
| 2020 | $13,778 | $708,000 | $443,900 | $264,100 |
| 2019 | $13,824 | $704,600 | $443,900 | $260,700 |
| 2018 | $13,437 | $696,200 | $443,900 | $252,300 |
| 2017 | $13,628 | $666,100 | $443,900 | $222,200 |
| 2016 | $13,595 | $660,900 | $443,900 | $217,000 |
| 2015 | $13,401 | $659,500 | $438,900 | $220,600 |
| 2014 | $12,822 | $630,400 | $418,900 | $211,500 |
Source: Public Records
Map
Nearby Homes
- 14 Sewall Brook Ln
- 5 Farm Rd
- 32 Cider Hill Ln
- 174 S Main St
- 65 Farm Road Lot 6
- 90 Maple St
- 20 Nason Hill Rd
- 137 Lake St
- 59 Spywood Rd
- 14 Fiske Pond Rd
- 00000 S Main St and Bullard St
- 27 Spywood Rd
- 21 Spywood Rd
- 615 Mayflower Landing
- 81 Brush Hill Rd
- 6 Hopewell Farm Rd
- 9 Adams Ln Unit 9
- 1 Adams Ln Unit 1
- 103 Farm St
- 114 Farm St
Your Personal Tour Guide
Ask me questions while you tour the home.