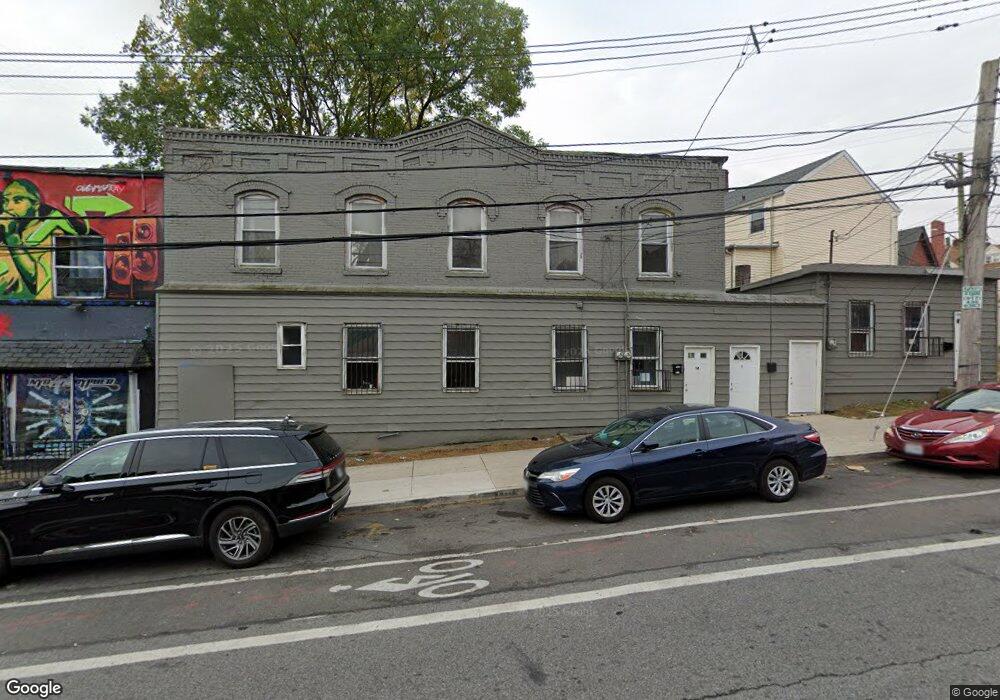
16 Broad St Unit 2 Staten Island, NY 10304
Stapleton NeighborhoodEstimated Value: $463,377 - $582,000
1
Bed
1
Bath
1,050
Sq Ft
$510/Sq Ft
Est. Value
About This Home
This home is located at 16 Broad St Unit 2, Staten Island, NY 10304 and is currently estimated at $535,344, approximately $509 per square foot. 16 Broad St Unit 2 is a home located in Richmond County with nearby schools including P.S. 78, P.S./I.S. 78Q Early Childhood Center, and I.S. 49 Berta A Dreyfus.
Ownership History
Date
Name
Owned For
Owner Type
Purchase Details
Closed on
Jul 30, 2007
Sold by
Wonica George S and Orosz Lauren
Bought by
Wonica George S and Orosz Christopher
Current Estimated Value
Purchase Details
Closed on
Jun 23, 2005
Sold by
Wonica George K and Wonica Valerie M
Bought by
Wonica George S and Orosz Lauren
Home Financials for this Owner
Home Financials are based on the most recent Mortgage that was taken out on this home.
Original Mortgage
$304,000
Outstanding Balance
$120,611
Interest Rate
2.12%
Mortgage Type
New Conventional
Estimated Equity
$414,733
Create a Home Valuation Report for This Property
The Home Valuation Report is an in-depth analysis detailing your home's value as well as a comparison with similar homes in the area
Home Values in the Area
Average Home Value in this Area
Purchase History
| Date | Buyer | Sale Price | Title Company |
|---|---|---|---|
| Wonica George S | -- | First Amer Title Ins Co Ny | |
| Wonica George S | $380,000 | First American Title Insuran |
Source: Public Records
Mortgage History
| Date | Status | Borrower | Loan Amount |
|---|---|---|---|
| Open | Wonica George S | $304,000 |
Source: Public Records
Tax History Compared to Growth
Tax History
| Year | Tax Paid | Tax Assessment Tax Assessment Total Assessment is a certain percentage of the fair market value that is determined by local assessors to be the total taxable value of land and additions on the property. | Land | Improvement |
|---|---|---|---|---|
| 2025 | $2,039 | $27,300 | $2,577 | $24,723 |
| 2024 | $2,039 | $23,160 | $2,867 | $20,293 |
| 2023 | $2,039 | $10,152 | $2,739 | $7,413 |
| 2022 | $2,010 | $21,060 | $6,540 | $14,520 |
| 2021 | $1,999 | $18,240 | $6,540 | $11,700 |
| 2020 | $2,990 | $18,960 | $6,540 | $12,420 |
| 2019 | $1,879 | $18,540 | $6,540 | $12,000 |
| 2018 | $1,725 | $8,460 | $4,191 | $4,269 |
| 2017 | $1,711 | $8,391 | $3,629 | $4,762 |
| 2016 | $1,583 | $7,917 | $3,184 | $4,733 |
| 2015 | -- | $7,470 | $2,763 | $4,707 |
| 2014 | -- | $7,050 | $3,129 | $3,921 |
Source: Public Records
Map
Nearby Homes
- 19 Broad St
- 684 Bay St
- 0 Broad St Unit 2400974
- 0 Broad St Unit 11250971
- 0 Broad St Unit 2400973
- 0 Broad St Unit 1150314
- 34 Broad St
- 75 Thompson St
- 57 Broad St
- 40 Tompkins St
- 1 Water St
- 64 Tompkins St
- 191 Canal St
- 66 Tappen Ct
- 49 Tompkins Cir
- 25 Tappen Ct
- 12 Court St
- 20 Tappen Ct
- 163 Boyd St
- 20 Court St