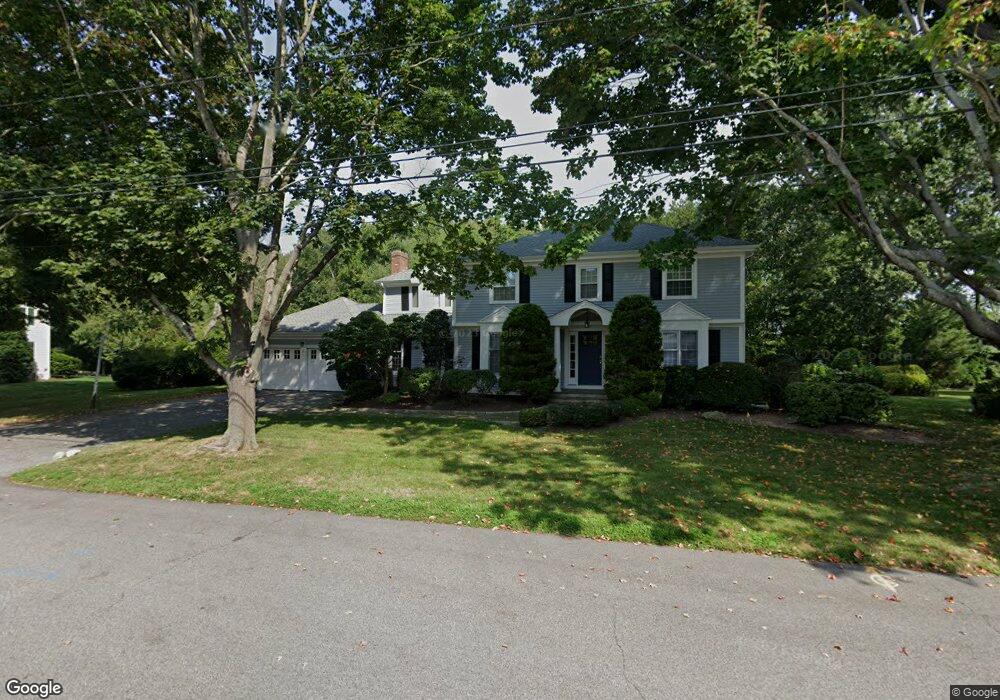
16 Broadview Dr Barrington, RI 02806
Nayatt NeighborhoodEstimated Value: $1,458,000 - $1,691,000
4
Beds
3
Baths
3,116
Sq Ft
$503/Sq Ft
Est. Value
About This Home
This home is located at 16 Broadview Dr, Barrington, RI 02806 and is currently estimated at $1,566,362, approximately $502 per square foot. 16 Broadview Dr is a home located in Bristol County with nearby schools including Barrington High School, St Luke Elementary School, and Barrington Christian Academy.
Ownership History
Date
Name
Owned For
Owner Type
Purchase Details
Closed on
Jun 12, 2009
Sold by
Ward Nicholas and Ward Laurie
Bought by
Morrow Eric M and Weinstein Deborah F
Current Estimated Value
Home Financials for this Owner
Home Financials are based on the most recent Mortgage that was taken out on this home.
Original Mortgage
$417,000
Outstanding Balance
$259,622
Interest Rate
4.82%
Mortgage Type
Purchase Money Mortgage
Estimated Equity
$1,306,740
Purchase Details
Closed on
Jul 7, 1999
Sold by
Feit Sandra J
Bought by
Ward Nicholas S and Ward Laurie
Home Financials for this Owner
Home Financials are based on the most recent Mortgage that was taken out on this home.
Original Mortgage
$240,000
Interest Rate
7.19%
Mortgage Type
Purchase Money Mortgage
Purchase Details
Closed on
Jun 25, 1991
Sold by
Glasgow Ty J
Bought by
Feit Elliot S
Purchase Details
Closed on
Aug 4, 1988
Sold by
Kinkead Robert
Bought by
Glasgow Ty
Create a Home Valuation Report for This Property
The Home Valuation Report is an in-depth analysis detailing your home's value as well as a comparison with similar homes in the area
Home Values in the Area
Average Home Value in this Area
Purchase History
| Date | Buyer | Sale Price | Title Company |
|---|---|---|---|
| Morrow Eric M | $765,000 | -- | |
| Ward Nicholas S | $451,500 | -- | |
| Feit Elliot S | $310,000 | -- | |
| Feit Elliot S | $310,000 | -- | |
| Glasgow Ty | $300,000 | -- | |
| Glasgow Ty | $300,000 | -- |
Source: Public Records
Mortgage History
| Date | Status | Borrower | Loan Amount |
|---|---|---|---|
| Open | Glasgow Ty | $417,000 | |
| Closed | Glasgow Ty | $200,000 | |
| Previous Owner | Glasgow Ty | $240,000 |
Source: Public Records
Tax History
| Year | Tax Paid | Tax Assessment Tax Assessment Total Assessment is a certain percentage of the fair market value that is determined by local assessors to be the total taxable value of land and additions on the property. | Land | Improvement |
|---|---|---|---|---|
| 2025 | $19,022 | $1,240,000 | $559,000 | $681,000 |
| 2024 | $18,290 | $1,240,000 | $559,000 | $681,000 |
| 2023 | $18,047 | $889,000 | $373,000 | $516,000 |
| 2022 | $17,469 | $889,000 | $373,000 | $516,000 |
| 2021 | $17,024 | $889,000 | $373,000 | $516,000 |
| 2020 | $17,640 | $844,000 | $349,000 | $495,000 |
| 2019 | $16,964 | $844,000 | $349,000 | $495,000 |
| 2018 | $16,458 | $844,000 | $349,000 | $495,000 |
| 2017 | $15,672 | $783,600 | $349,300 | $434,300 |
| 2016 | $14,457 | $783,600 | $349,300 | $434,300 |
| 2015 | $14,301 | $783,600 | $349,300 | $434,300 |
| 2014 | $13,149 | $718,500 | $365,200 | $353,300 |
Source: Public Records
Map
Nearby Homes
- 381 Maple Ave
- 53 Whipple Ave
- 603 Maple Ave
- 351 County Rd
- 26 Tiffany Cir
- 29 N Lake Dr
- 51 Hawthorne Ave
- 154 Lincoln Ave
- 22 Lantern Ln
- 6 Conway Dr
- 11 Mathewson Rd
- 150 Alfred Drowne Rd
- 20 Townsend St
- 74 Adams Point Rd
- 10 Jesse Davis Ln
- 71 Alfred Drown Rd
- 1 Massasoit Ave
- 0 Hampden St
- 11 Elton Rd
- 9 Lillis Ave
- 14 Broadview Dr
- 17 Broadview Dr
- 18 Broadview Dr
- 15 Broadview Dr
- 4 Crestwood Rd
- 20 Broadview Dr
- 7 Crestwood Rd
- 12 Broadview Dr
- 13 Broadview Dr
- 1 Ferncliff Rd
- 22 Broadview Dr
- 2 Crestwood Rd
- 3 Ferncliff Rd
- 8 Ridgeland Rd
- 5 Crestwood Rd
- 10 Broadview Dr
- 14 Devonshire Dr
- 5 Ferncliff Rd
- 3 Crestwood Rd
- 6 Ridgeland Rd
Your Personal Tour Guide
Ask me questions while you tour the home.