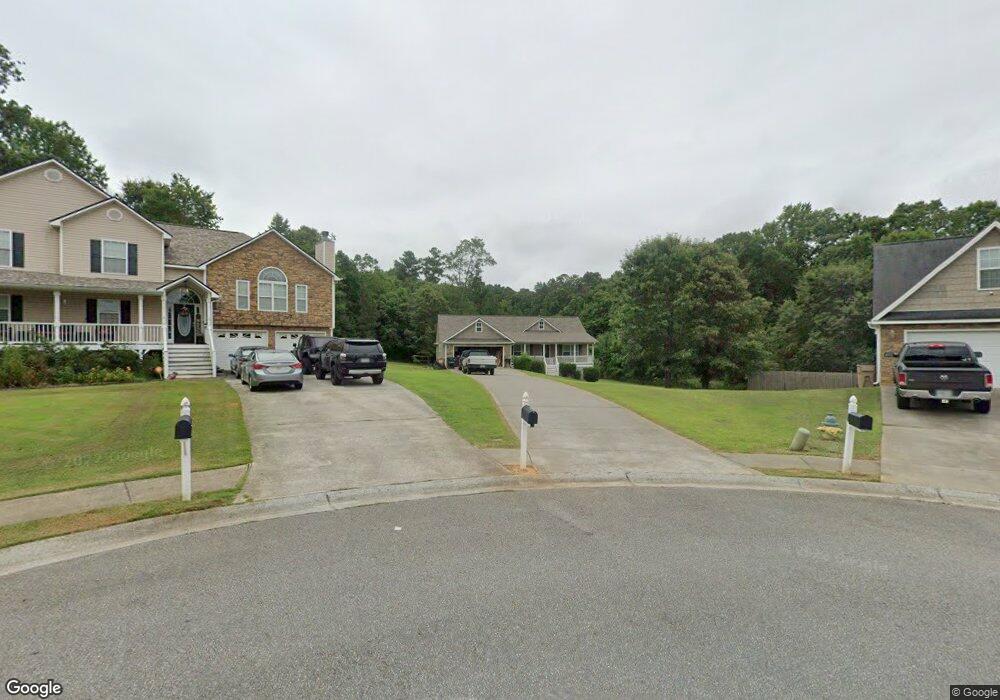
16 Calvary Ct NW Unit 4 Cartersville, GA 30120
Estimated Value: $404,000 - $459,000
5
Beds
3
Baths
3,114
Sq Ft
$141/Sq Ft
Est. Value
About This Home
This home is located at 16 Calvary Ct NW Unit 4, Cartersville, GA 30120 and is currently estimated at $437,930, approximately $140 per square foot. 16 Calvary Ct NW Unit 4 is a home located in Bartow County with nearby schools including Hamilton Crossing Elementary School, Cass Middle School, and Cass High School.
Ownership History
Date
Name
Owned For
Owner Type
Purchase Details
Closed on
Apr 7, 2015
Sold by
Stevens Jeremy W
Bought by
King Debra and Pritchett Harvey Scott
Current Estimated Value
Home Financials for this Owner
Home Financials are based on the most recent Mortgage that was taken out on this home.
Original Mortgage
$159,900
Outstanding Balance
$124,027
Interest Rate
3.95%
Mortgage Type
FHA
Estimated Equity
$313,903
Purchase Details
Closed on
Feb 23, 2012
Bought by
Stevens Jeremy W
Purchase Details
Closed on
Jul 15, 2011
Sold by
Fdic
Bought by
Renasant Bank
Purchase Details
Closed on
Jul 6, 2010
Sold by
Marsr Properties Llc
Bought by
Crescent Bank
Purchase Details
Closed on
Feb 27, 2008
Sold by
Regions Bank
Bought by
Marsr Properties Inc
Home Financials for this Owner
Home Financials are based on the most recent Mortgage that was taken out on this home.
Original Mortgage
$146,250
Interest Rate
5.63%
Mortgage Type
New Conventional
Purchase Details
Closed on
Dec 4, 2007
Sold by
Regions Bank
Bought by
Regions Bank
Purchase Details
Closed on
Jun 23, 2006
Sold by
Glass Shirley
Bought by
Day David A
Create a Home Valuation Report for This Property
The Home Valuation Report is an in-depth analysis detailing your home's value as well as a comparison with similar homes in the area
Home Values in the Area
Average Home Value in this Area
Purchase History
| Date | Buyer | Sale Price | Title Company |
|---|---|---|---|
| King Debra | $162,900 | -- | |
| Stevens Jeremy W | $111,600 | -- | |
| Stevens Jeremy W | $111,600 | -- | |
| Renasant Bank | -- | -- | |
| Crescent Bank | -- | -- | |
| Marsr Properties Inc | $131,500 | -- | |
| Regions Bank | -- | -- | |
| Day David A | $39,500 | -- |
Source: Public Records
Mortgage History
| Date | Status | Borrower | Loan Amount |
|---|---|---|---|
| Open | King Debra | $159,900 | |
| Previous Owner | Marsr Properties Inc | $146,250 |
Source: Public Records
Tax History Compared to Growth
Tax History
| Year | Tax Paid | Tax Assessment Tax Assessment Total Assessment is a certain percentage of the fair market value that is determined by local assessors to be the total taxable value of land and additions on the property. | Land | Improvement |
|---|---|---|---|---|
| 2024 | $3,146 | $179,327 | $26,000 | $153,327 |
| 2023 | $3,243 | $167,484 | $26,000 | $141,484 |
| 2022 | $3,335 | $137,902 | $18,000 | $119,902 |
| 2021 | $2,760 | $110,064 | $18,000 | $92,064 |
| 2020 | $2,515 | $96,542 | $16,000 | $80,542 |
| 2019 | $2,454 | $93,407 | $20,000 | $73,407 |
| 2018 | $2,309 | $87,862 | $12,000 | $75,862 |
| 2017 | $2,065 | $78,741 | $12,000 | $66,741 |
| 2016 | $1,838 | $65,160 | $12,000 | $53,160 |
| 2015 | $1,605 | $56,800 | $12,000 | $44,800 |
| 2014 | $1,259 | $43,160 | $9,600 | $33,560 |
| 2013 | -- | $43,160 | $9,600 | $33,560 |
Source: Public Records
Map
Nearby Homes
- 18 Planters Dr NW
- 281 Georgia 293
- 548 Summerfield Ln NW
- 181 Kingston Highway 293 NW
- 525 Summerfield Ln NW
- 300 Pescara Ct NW
- Dempsey Plan at Hamilton Place
- Liston Plan at Hamilton Place
- Braddock Plan at Hamilton Place
- Willard Plan at Hamilton Place
- Frazier Plan at Hamilton Place
- 653 Summerfield Ln NW
- 110 Jane Blvd NW
- 128 Jane Blvd NW
- 114 NW Jane Blvd
- 120 NW Jane Blvd
- 136 Jane Blvd
- 109 Jane Blvd
- 124 Jane Blvd
- 16 Calvary Ct NW
- 17 Calvary Ct NW
- 14 Calvary Ct NW
- 15 Calvary Ct NW
- 10 Cass Station Dr NW
- 307 Fire Tower Rd NW
- 13 Calvary Ct NW
- 12 Calvary Ct NW
- 305 Fire Tower Rd NW
- 343 Fire Tower Rd NW
- 343 Fire Tower Rd NW
- 15 Willow Wood Ln NW
- 20 Cass Station Dr NW
- 20 Cass Station Dr NW Unit 1
- 11 Willow Wood Ln NW
- 220 Highway 293 SE
- 19 Cass Station Dr NW
- 236 Highway 293 SE
- 236 Kingston Highway 293 NW
- 236 Kingston Highway 293 NW