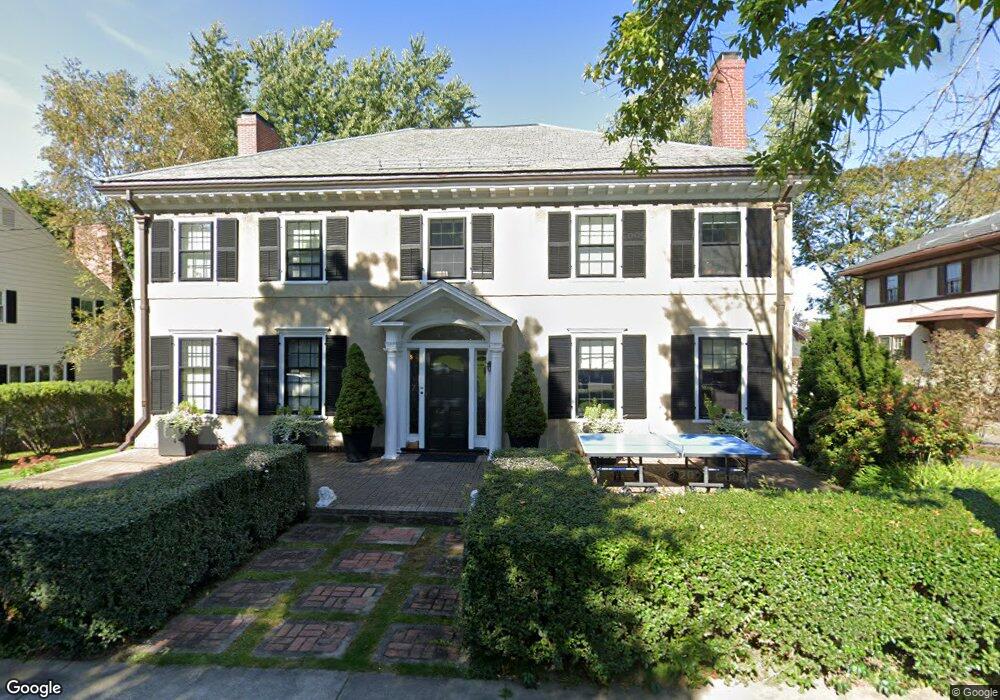
16 Cedar Rd Belmont, MA 02478
Belmont Center NeighborhoodEstimated Value: $2,691,000 - $3,220,000
5
Beds
4
Baths
4,274
Sq Ft
$688/Sq Ft
Est. Value
About This Home
This home is located at 16 Cedar Rd, Belmont, MA 02478 and is currently estimated at $2,939,449, approximately $687 per square foot. 16 Cedar Rd is a home located in Middlesex County with nearby schools including Roger Wellington Elementary School, Winthrop L Chenery Middle School, and Belmont High School.
Ownership History
Date
Name
Owned For
Owner Type
Purchase Details
Closed on
Sep 4, 2025
Sold by
Weinstein Steven D and Gavin Joellen L
Bought by
16 Cedar Road Rt and Weinstein
Current Estimated Value
Purchase Details
Closed on
May 20, 2011
Sold by
Newberg Joseph H and Melnikoff Alice V
Bought by
Weinstein Steven D and Gavin Joellen L
Home Financials for this Owner
Home Financials are based on the most recent Mortgage that was taken out on this home.
Original Mortgage
$350,000
Interest Rate
4.88%
Mortgage Type
Purchase Money Mortgage
Create a Home Valuation Report for This Property
The Home Valuation Report is an in-depth analysis detailing your home's value as well as a comparison with similar homes in the area
Home Values in the Area
Average Home Value in this Area
Purchase History
| Date | Buyer | Sale Price | Title Company |
|---|---|---|---|
| 16 Cedar Road Rt | -- | -- | |
| Weinstein Steven D | $1,529,500 | -- | |
| Weinstein Steven D | $1,529,500 | -- |
Source: Public Records
Mortgage History
| Date | Status | Borrower | Loan Amount |
|---|---|---|---|
| Previous Owner | Weinstein Steven D | $386,200 | |
| Previous Owner | Weinstein Steven D | $350,000 |
Source: Public Records
Tax History Compared to Growth
Tax History
| Year | Tax Paid | Tax Assessment Tax Assessment Total Assessment is a certain percentage of the fair market value that is determined by local assessors to be the total taxable value of land and additions on the property. | Land | Improvement |
|---|---|---|---|---|
| 2025 | $29,295 | $2,572,000 | $1,061,000 | $1,511,000 |
| 2024 | $27,435 | $2,598,000 | $1,322,000 | $1,276,000 |
| 2023 | $25,459 | $2,265,000 | $1,009,000 | $1,256,000 |
| 2022 | $24,230 | $2,096,000 | $923,000 | $1,173,000 |
| 2021 | $22,895 | $1,984,000 | $1,010,000 | $974,000 |
| 2020 | $24,794 | $2,254,000 | $1,077,000 | $1,177,000 |
| 2019 | $21,683 | $1,858,000 | $840,000 | $1,018,000 |
| 2018 | $20,424 | $1,681,000 | $679,000 | $1,002,000 |
| 2017 | $20,558 | $1,620,000 | $623,000 | $997,000 |
| 2016 | $20,247 | $1,612,000 | $623,000 | $989,000 |
| 2015 | $19,492 | $1,511,000 | $532,000 | $979,000 |
Source: Public Records
Map
Nearby Homes
- 38 Myrtle St
- 1 Spinney Terrace
- 263 Common St
- 69 Horace Rd
- 36 Madison St
- 66 Channing Rd
- 160 Waverley St
- 72-74 Flett Rd
- 59-61 Gilbert Rd
- 23 Centre Ave
- 105 Watson Rd
- 33 Slade St Unit 1
- 55-57 Hawthorne St
- 33 Wellington Ln
- 125 Trapelo Rd Unit 21
- 125 Trapelo Rd Unit 23
- 48 Concord Ave
- 73 Trowbridge St Unit 73A
- 73 Trowbridge St Unit 73B
- 2 Bartlett Ave Unit 1