
Seller's Agent in 2021
Anthony Poulin
Meservier & Associates
(207) 212-1746
58 in this area
280 Total Sales

Estimated Value: $336,000 - $420,000
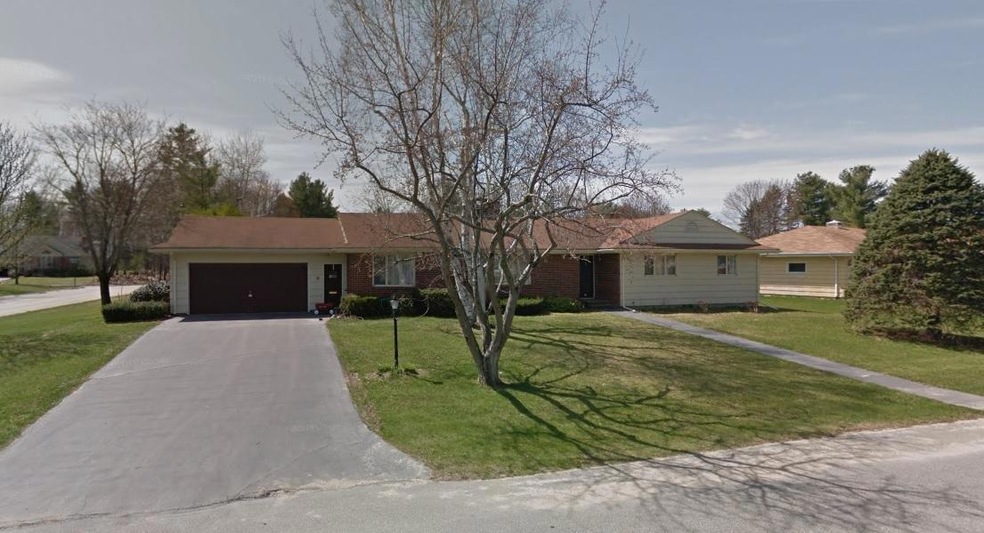
This home is located at 16 Champlain Ave, Lewiston, ME 04240 since 06 January 2021 and is currently estimated at $373,358, approximately $131 per square foot. This property was built in 1967. 16 Champlain Ave is a home located in Androscoggin County with nearby schools including Raymond A. Geiger Elementary School, Lewiston Middle School, and Lewiston High School.
| Date | Buyer | Sale Price | Title Company |
|---|---|---|---|
| Moussa Realty Llc | -- | None Available |
| Date | Status | Borrower | Loan Amount |
|---|---|---|---|
| Open | Moussa Realty Llc | $130,000 |
| Date | Event | Price | List to Sale | Price per Sq Ft |
|---|---|---|---|---|
| 07/19/2021 07/19/21 | Sold | $201,000 | -8.6% | $71 / Sq Ft |
| 01/06/2021 01/06/21 | For Sale | $220,000 | -- | $77 / Sq Ft |
| 05/26/2020 05/26/20 | Pending | -- | -- | -- |
| Year | Tax Paid | Tax Assessment Tax Assessment Total Assessment is a certain percentage of the fair market value that is determined by local assessors to be the total taxable value of land and additions on the property. | Land | Improvement |
|---|---|---|---|---|
| 2025 | $5,451 | $166,300 | $31,560 | $134,740 |
| 2024 | $5,283 | $166,300 | $31,560 | $134,740 |
| 2023 | $4,989 | $166,300 | $31,560 | $134,740 |
| 2022 | $4,740 | $166,300 | $31,560 | $134,740 |
| 2021 | $4,600 | $162,780 | $31,560 | $131,220 |
| 2020 | $4,667 | $162,780 | $31,560 | $131,220 |
| 2019 | $4,706 | $162,780 | $31,560 | $131,220 |
| 2018 | $4,667 | $162,780 | $31,560 | $131,220 |
| 2017 | $4,561 | $162,780 | $31,560 | $131,220 |
| 2016 | $4,483 | $162,780 | $31,560 | $131,220 |
| 2015 | $4,455 | $162,780 | $31,560 | $131,220 |
| 2014 | $4,328 | $162,780 | $31,560 | $131,220 |
| 2013 | $4,304 | $162,780 | $31,560 | $131,220 |
Seller's Agent in 2021
Anthony Poulin
Meservier & Associates
(207) 212-1746
58 in this area
280 Total Sales
Source: Maine Listings
MLS Number: 1479210
APN: LEWI-000170-000000-000229
Disclaimer: Certain information contained herein is derived from information provided by parties other than Homes.com. All information provided is deemed reliable, but is not guaranteed to be accurate and should be independently verified.
![]() Listing data is derived in whole or in part from Maine Real Estate Information System, Inc. (d/b/a Maine Listings) and is for consumers' personal, noncommercial use only. Dimensions are approximate and not guaranteed. All data should be independently verified.
Listing data is derived in whole or in part from Maine Real Estate Information System, Inc. (d/b/a Maine Listings) and is for consumers' personal, noncommercial use only. Dimensions are approximate and not guaranteed. All data should be independently verified.
© 2026 Maine Real Estate Information System, Inc. All Rights Reserved. Equal Housing Opportunity.
Homes.com, LLC, 17600 Laguna Canyon Rd Irvine, CA 92618 (888)-952-6393
![]()
Ask me questions while you tour the home.