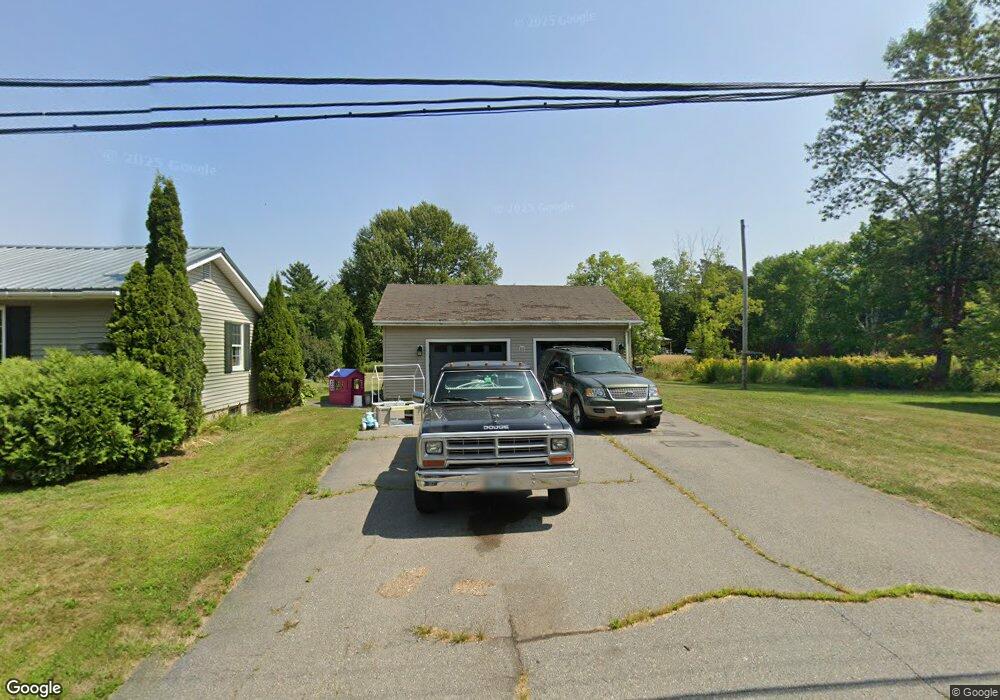
16 Chapel St Calais, ME 04619
Estimated Value: $103,000 - $223,000
3
Beds
2
Baths
1,552
Sq Ft
$114/Sq Ft
Est. Value
About This Home
This home is located at 16 Chapel St, Calais, ME 04619 and is currently estimated at $177,244, approximately $114 per square foot. 16 Chapel St is a home located in Washington County with nearby schools including Calais Elementary School and Calais Middle/High School.
Ownership History
Date
Name
Owned For
Owner Type
Purchase Details
Closed on
Oct 2, 2009
Sold by
Burns Robert and Burns Lorna
Bought by
Moores 3Rd Gordon and Moores Amanda G
Current Estimated Value
Home Financials for this Owner
Home Financials are based on the most recent Mortgage that was taken out on this home.
Original Mortgage
$99,500
Outstanding Balance
$65,104
Interest Rate
5.12%
Mortgage Type
Commercial
Estimated Equity
$112,140
Purchase Details
Closed on
Aug 15, 2007
Sold by
Clark William F
Bought by
Burns Robert E and Burns Lorna M
Create a Home Valuation Report for This Property
The Home Valuation Report is an in-depth analysis detailing your home's value as well as a comparison with similar homes in the area
Home Values in the Area
Average Home Value in this Area
Purchase History
| Date | Buyer | Sale Price | Title Company |
|---|---|---|---|
| Moores 3Rd Gordon | -- | -- | |
| Burns Robert E | -- | -- |
Source: Public Records
Mortgage History
| Date | Status | Borrower | Loan Amount |
|---|---|---|---|
| Open | Moores 3Rd Gordon | $99,500 |
Source: Public Records
Tax History Compared to Growth
Tax History
| Year | Tax Paid | Tax Assessment Tax Assessment Total Assessment is a certain percentage of the fair market value that is determined by local assessors to be the total taxable value of land and additions on the property. | Land | Improvement |
|---|---|---|---|---|
| 2024 | $1,848 | $123,200 | $15,400 | $107,800 |
| 2023 | $1,807 | $106,300 | $13,300 | $93,000 |
| 2022 | $1,632 | $85,900 | $10,700 | $75,200 |
| 2021 | $1,780 | $82,400 | $10,300 | $72,100 |
| 2020 | $1,781 | $70,400 | $8,800 | $61,600 |
| 2019 | $1,781 | $70,400 | $8,800 | $61,600 |
| 2018 | $1,781 | $70,400 | $8,800 | $61,600 |
| 2017 | $1,781 | $70,400 | $8,800 | $61,600 |
| 2016 | $1,781 | $70,400 | $8,800 | $61,600 |
| 2015 | $1,781 | $70,400 | $8,800 | $61,600 |
| 2014 | $1,781 | $70,400 | $8,800 | $61,600 |
| 2013 | -- | $70,400 | $8,800 | $61,600 |
Source: Public Records
Map
Nearby Homes
- 43 Harrison St
- 71-75 Baring St
- 445 South St
- 332 North St
- P/O Lot 6 Higgins Farm Rd
- Lot 5 Higgins Farm Rd
- Lot 4 Higgins Farm Rd
- 33 Pleasant St
- M5B7L8 Pleasant St
- 24 Todd St
- 69 Lafayette St
- 100 Barker St
- 37 Price St
- 34 Price St
- 1 Downes St
- 48 Germain St
- 89 Washington St
- 158 South St
- 35 Germain St
- 79 North St