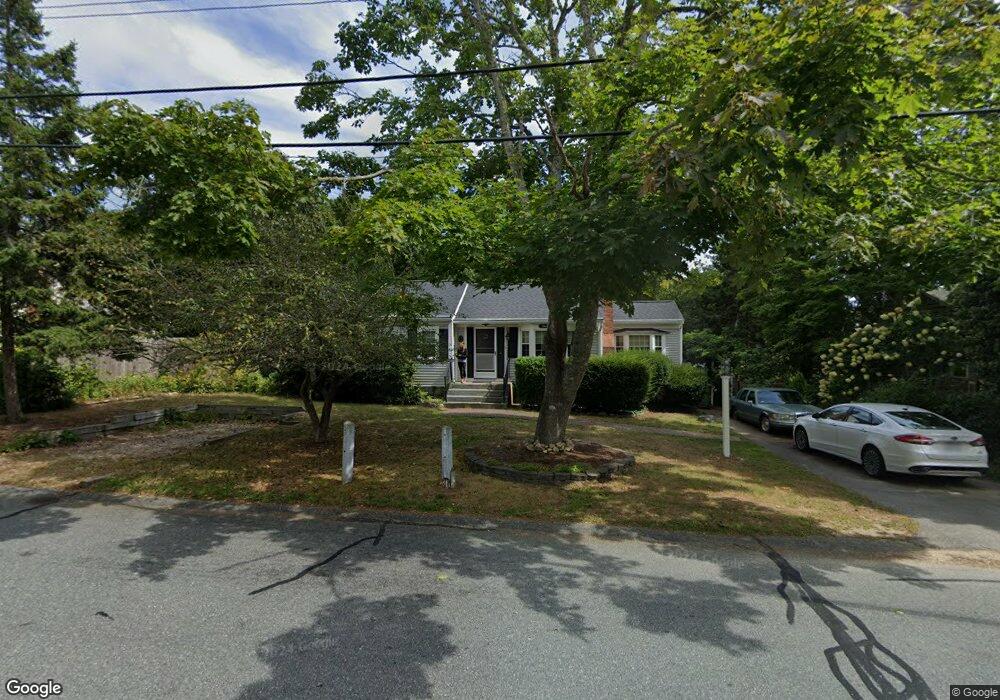
16 Charles St South Dennis, MA 02660
South Dennis NeighborhoodEstimated Value: $544,317 - $612,000
3
Beds
1
Bath
1,001
Sq Ft
$583/Sq Ft
Est. Value
About This Home
This home is located at 16 Charles St, South Dennis, MA 02660 and is currently estimated at $583,579, approximately $582 per square foot. 16 Charles St is a home located in Barnstable County with nearby schools including Dennis-Yarmouth Regional High School and St. Pius X. School.
Ownership History
Date
Name
Owned For
Owner Type
Purchase Details
Closed on
Dec 14, 2022
Sold by
Gillette Rita P
Bought by
Gillette Ft
Current Estimated Value
Purchase Details
Closed on
Jan 27, 2021
Sold by
Gillette Ft
Bought by
Gillette Rita P
Purchase Details
Closed on
Jun 8, 2017
Sold by
Gillette Ft
Bought by
Gillette Ft
Purchase Details
Closed on
May 30, 2012
Sold by
Gillette Ft and Gillette Clarence L
Bought by
Gillette Clarence L and Gillette Rita P
Create a Home Valuation Report for This Property
The Home Valuation Report is an in-depth analysis detailing your home's value as well as a comparison with similar homes in the area
Home Values in the Area
Average Home Value in this Area
Purchase History
| Date | Buyer | Sale Price | Title Company |
|---|---|---|---|
| Gillette Ft | -- | None Available | |
| Gillette Rita P | -- | None Available | |
| Gillette Ft | -- | -- | |
| Gillette Clarence L | -- | -- |
Source: Public Records
Tax History Compared to Growth
Tax History
| Year | Tax Paid | Tax Assessment Tax Assessment Total Assessment is a certain percentage of the fair market value that is determined by local assessors to be the total taxable value of land and additions on the property. | Land | Improvement |
|---|---|---|---|---|
| 2025 | $2,089 | $482,400 | $131,100 | $351,300 |
| 2024 | $1,986 | $452,500 | $126,100 | $326,400 |
| 2023 | $1,921 | $411,400 | $114,600 | $296,800 |
| 2022 | $1,880 | $335,800 | $114,700 | $221,100 |
| 2021 | $1,785 | $296,100 | $112,500 | $183,600 |
| 2020 | $1,703 | $279,100 | $112,500 | $166,600 |
| 2019 | $1,662 | $269,400 | $121,300 | $148,100 |
| 2018 | $1,487 | $234,600 | $105,000 | $129,600 |
| 2017 | $1,417 | $230,400 | $105,000 | $125,400 |
| 2016 | $1,395 | $213,600 | $110,200 | $103,400 |
| 2015 | $1,367 | $213,600 | $110,200 | $103,400 |
| 2014 | $1,298 | $204,400 | $94,500 | $109,900 |
Source: Public Records
Map
Nearby Homes
- 17 Margate Ln
- 153 Bayridge Dr
- 11 Uncle Stanleys Way
- 10 Joanne Dr
- 15 Captain Jud Rd
- 17 Fairmount Rd
- 4 Ebb Rd
- 17 Fairmount Rd
- 25 Skerry Rd
- 7 Vinland Dr
- 1 Norseman Dr
- 118 Driftwood Ln
- 129 Driftwood Ln
- 62 Old Fish House Rd
- 6 Hawthorn St
- 13 Covey Dr
- 111 Merchant Ave
- 4 Old Colony Way
- 32 Captain Walsh Dr
- 85 Keel Cape Dr