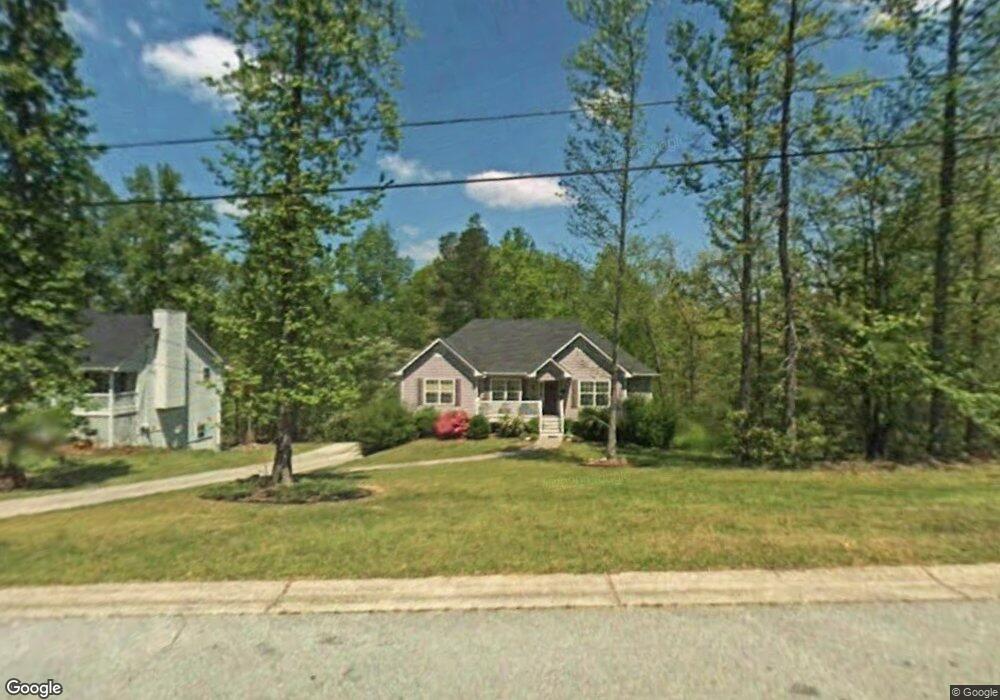
16 Clay Ct Unit 27 Villa Rica, GA 30180
Estimated Value: $296,000 - $320,000
4
Beds
3
Baths
1,377
Sq Ft
$225/Sq Ft
Est. Value
About This Home
This home is located at 16 Clay Ct Unit 27, Villa Rica, GA 30180 and is currently estimated at $310,392, approximately $225 per square foot. 16 Clay Ct Unit 27 is a home located in Carroll County with nearby schools including Glanton-Hindsman Elementary School, Villa Rica Middle School, and Villa Rica High School.
Ownership History
Date
Name
Owned For
Owner Type
Purchase Details
Closed on
Dec 14, 2018
Sold by
Rainey Donald K
Bought by
Rogers Nyoka S
Current Estimated Value
Home Financials for this Owner
Home Financials are based on the most recent Mortgage that was taken out on this home.
Original Mortgage
$151,320
Outstanding Balance
$133,582
Interest Rate
4.9%
Mortgage Type
New Conventional
Estimated Equity
$176,810
Purchase Details
Closed on
Jun 26, 2003
Sold by
Rainey Donald K
Bought by
Rainey Donald K and Tousignant Marlen
Purchase Details
Closed on
Aug 22, 2002
Sold by
Primacy Closing Corporation
Bought by
Rainey Donald K
Purchase Details
Closed on
Oct 19, 1998
Sold by
Hitchcock D L
Bought by
Nasworthy Sara
Purchase Details
Closed on
Jan 3, 1996
Sold by
Villa Partners
Bought by
Hitchcock D L
Purchase Details
Closed on
Jul 11, 1994
Bought by
Villa Partners
Create a Home Valuation Report for This Property
The Home Valuation Report is an in-depth analysis detailing your home's value as well as a comparison with similar homes in the area
Home Values in the Area
Average Home Value in this Area
Purchase History
| Date | Buyer | Sale Price | Title Company |
|---|---|---|---|
| Rogers Nyoka S | $156,000 | -- | |
| Rainey Donald K | -- | -- | |
| Rainey Donald K | $126,500 | -- | |
| Primacy Closing Corporation | -- | -- | |
| Nasworthy Sara | $99,900 | -- | |
| Hitchcock D L | $12,800 | -- | |
| Villa Partners | $169,000 | -- |
Source: Public Records
Mortgage History
| Date | Status | Borrower | Loan Amount |
|---|---|---|---|
| Open | Rogers Nyoka S | $151,320 |
Source: Public Records
Tax History Compared to Growth
Tax History
| Year | Tax Paid | Tax Assessment Tax Assessment Total Assessment is a certain percentage of the fair market value that is determined by local assessors to be the total taxable value of land and additions on the property. | Land | Improvement |
|---|---|---|---|---|
| 2024 | $2,974 | $131,460 | $8,000 | $123,460 |
| 2023 | $2,974 | $120,198 | $8,000 | $112,198 |
| 2022 | $2,460 | $98,092 | $8,000 | $90,092 |
| 2021 | $1,860 | $72,553 | $8,000 | $64,553 |
| 2020 | $1,674 | $65,208 | $8,000 | $57,208 |
| 2019 | $1,583 | $61,175 | $8,000 | $53,175 |
| 2018 | $1,180 | $51,424 | $8,000 | $43,424 |
| 2017 | $1,211 | $52,962 | $8,000 | $44,962 |
| 2016 | $1,212 | $52,962 | $8,000 | $44,962 |
| 2015 | $1,107 | $43,568 | $8,000 | $35,569 |
| 2014 | $1,111 | $43,569 | $8,000 | $35,569 |
Source: Public Records
Map
Nearby Homes
- 114 Clay Ct
- 84 Ledbetter Rd
- 141 Ledbetter Rd
- 232 Harlan Heights Rd
- 1180 Harlan Lane Rd
- 37 Tapley Rd
- 1052 Harlan Lane Rd
- 104 Dalton Dr
- 101 Cedars Glen Cir
- 100 Cedars Glen Cir
- 213 Cornell Ct
- 17 Cedars Glen Place
- 178 Cedars Glen Cir
- 337 Cranmore Place
- 104 Amidon Dr
- 227 Cedars Glen Cir
- 504 Iris Way
- 160 Amidon Dr