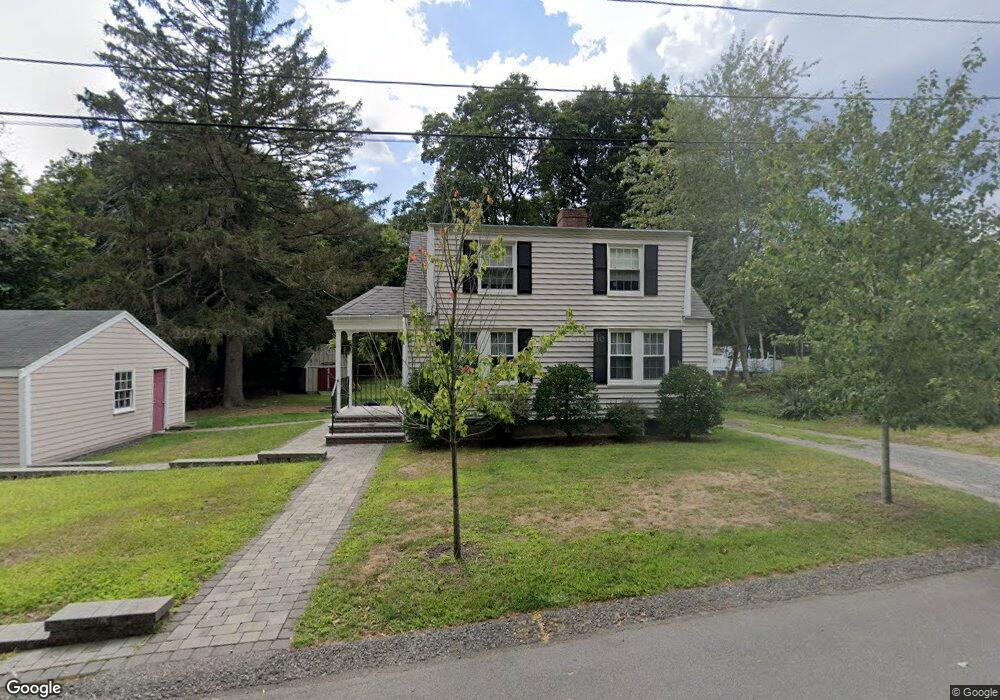
16 Clifford Ct Hingham, MA 02043
Estimated Value: $821,693 - $1,023,000
4
Beds
2
Baths
1,805
Sq Ft
$518/Sq Ft
Est. Value
About This Home
This home is located at 16 Clifford Ct, Hingham, MA 02043 and is currently estimated at $934,423, approximately $517 per square foot. 16 Clifford Ct is a home located in Plymouth County with nearby schools including Plymouth River Elementary School, Hingham Middle School, and Hingham High School.
Ownership History
Date
Name
Owned For
Owner Type
Purchase Details
Closed on
Nov 17, 2011
Sold by
Perchard 3Rd John R
Bought by
Perchard 3Rd John R and Perchard Amy
Current Estimated Value
Home Financials for this Owner
Home Financials are based on the most recent Mortgage that was taken out on this home.
Original Mortgage
$416,938
Outstanding Balance
$282,935
Interest Rate
3.92%
Mortgage Type
Purchase Money Mortgage
Estimated Equity
$651,488
Purchase Details
Closed on
Mar 17, 2008
Sold by
Ricketts Lois C
Bought by
Perchard John
Home Financials for this Owner
Home Financials are based on the most recent Mortgage that was taken out on this home.
Original Mortgage
$416,772
Interest Rate
5.72%
Mortgage Type
Purchase Money Mortgage
Create a Home Valuation Report for This Property
The Home Valuation Report is an in-depth analysis detailing your home's value as well as a comparison with similar homes in the area
Purchase History
| Date | Buyer | Sale Price | Title Company |
|---|---|---|---|
| Perchard 3Rd John R | -- | -- | |
| Perchard John | $420,000 | -- |
Source: Public Records
Mortgage History
| Date | Status | Borrower | Loan Amount |
|---|---|---|---|
| Open | Perchard 3Rd John R | $416,938 | |
| Previous Owner | Perchard John | $414,503 | |
| Previous Owner | Perchard John | $417,000 | |
| Previous Owner | Perchard John | $416,772 |
Source: Public Records
Tax History
| Year | Tax Paid | Tax Assessment Tax Assessment Total Assessment is a certain percentage of the fair market value that is determined by local assessors to be the total taxable value of land and additions on the property. | Land | Improvement |
|---|---|---|---|---|
| 2025 | $6,764 | $632,700 | $320,300 | $312,400 |
| 2024 | $6,177 | $569,300 | $320,300 | $249,000 |
| 2023 | $5,578 | $557,800 | $320,300 | $237,500 |
| 2022 | $6,032 | $521,800 | $288,700 | $233,100 |
| 2021 | $5,834 | $494,400 | $288,700 | $205,700 |
| 2020 | $5,700 | $494,400 | $288,700 | $205,700 |
| 2019 | $5,687 | $481,500 | $288,700 | $192,800 |
| 2018 | $5,583 | $474,300 | $288,700 | $185,600 |
| 2017 | $5,122 | $418,100 | $244,200 | $173,900 |
| 2016 | $5,040 | $403,500 | $232,500 | $171,000 |
| 2015 | $4,825 | $385,100 | $221,300 | $163,800 |
Source: Public Records
Map
Nearby Homes
- 20 Clifford Ct
- 10 Clifford Ct
- 22 Clifford Ct
- 22 Clifford Ct
- 13 Fresh River Ave
- 17 Fresh River Ave
- 24 Clifford Ct
- 3 Stevens Way
- 21 Fresh River Ave
- 4 Sherman Way
- 2 Sherman Way
- 29 Fresh River Ave
- 5 Stevens Way
- 181 Fort Hill St
- 12 Fresh River Ave
- 16 Fresh River Ave
- 1 Stevens Way
- 18 Fresh River Ave
- 20 Fresh River Ave
- 6 Sherman Way
Your Personal Tour Guide
Ask me questions while you tour the home.