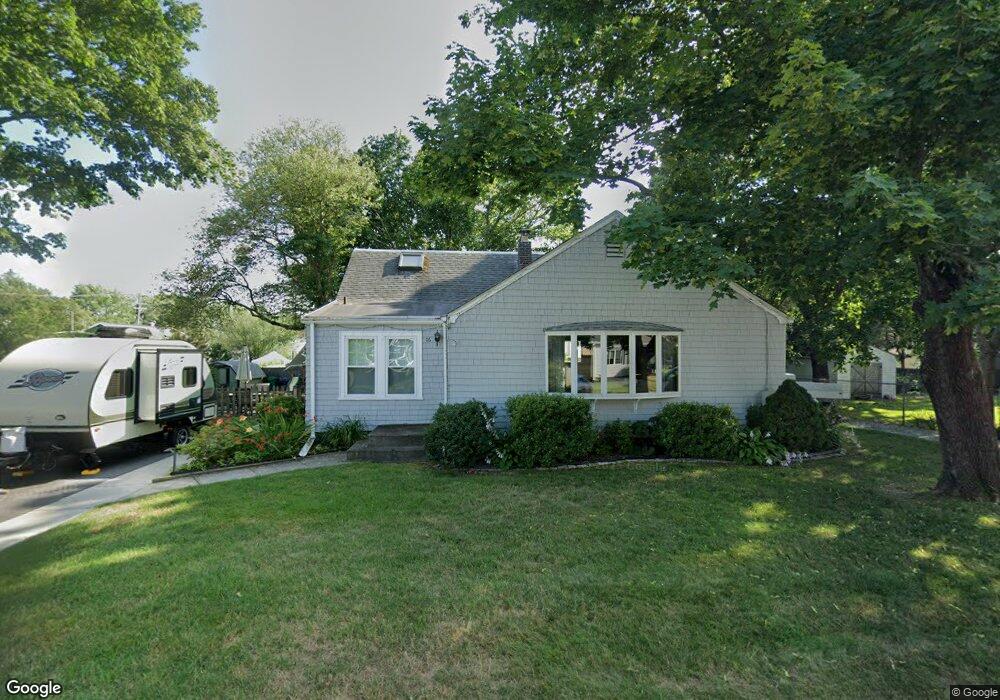
16 Congress St Warwick, RI 02889
Long Meadow NeighborhoodEstimated Value: $452,000 - $468,000
3
Beds
2
Baths
1,828
Sq Ft
$250/Sq Ft
Est. Value
About This Home
This home is located at 16 Congress St, Warwick, RI 02889 and is currently estimated at $457,625, approximately $250 per square foot. 16 Congress St is a home located in Kent County with nearby schools including Saint Kevin School and Bishop Hendricken High School.
Ownership History
Date
Name
Owned For
Owner Type
Purchase Details
Closed on
Jul 18, 2017
Sold by
Fielding Jo A
Bought by
Fielding Jo A
Current Estimated Value
Create a Home Valuation Report for This Property
The Home Valuation Report is an in-depth analysis detailing your home's value as well as a comparison with similar homes in the area
Home Values in the Area
Average Home Value in this Area
Purchase History
| Date | Buyer | Sale Price | Title Company |
|---|---|---|---|
| Fielding Jo A | -- | -- |
Source: Public Records
Tax History Compared to Growth
Tax History
| Year | Tax Paid | Tax Assessment Tax Assessment Total Assessment is a certain percentage of the fair market value that is determined by local assessors to be the total taxable value of land and additions on the property. | Land | Improvement |
|---|---|---|---|---|
| 2025 | $5,008 | $394,300 | $115,700 | $278,600 |
| 2024 | $5,027 | $347,400 | $100,600 | $246,800 |
| 2023 | $4,930 | $347,400 | $100,600 | $246,800 |
| 2022 | $4,668 | $249,200 | $64,800 | $184,400 |
| 2021 | $4,668 | $249,200 | $64,800 | $184,400 |
| 2020 | $4,668 | $249,200 | $64,800 | $184,400 |
| 2019 | $4,668 | $249,200 | $64,800 | $184,400 |
| 2018 | $4,418 | $212,400 | $64,800 | $147,600 |
| 2017 | $4,299 | $212,400 | $64,800 | $147,600 |
| 2016 | $4,299 | $212,400 | $64,800 | $147,600 |
| 2015 | $3,940 | $189,900 | $61,200 | $128,700 |
| 2014 | $3,809 | $189,900 | $61,200 | $128,700 |
| 2013 | $3,758 | $189,900 | $61,200 | $128,700 |
Source: Public Records
Map
Nearby Homes