Estimated Value: $588,000 - $1,035,506
5
Beds
4
Baths
1,945
Sq Ft
$417/Sq Ft
Est. Value
About This Home
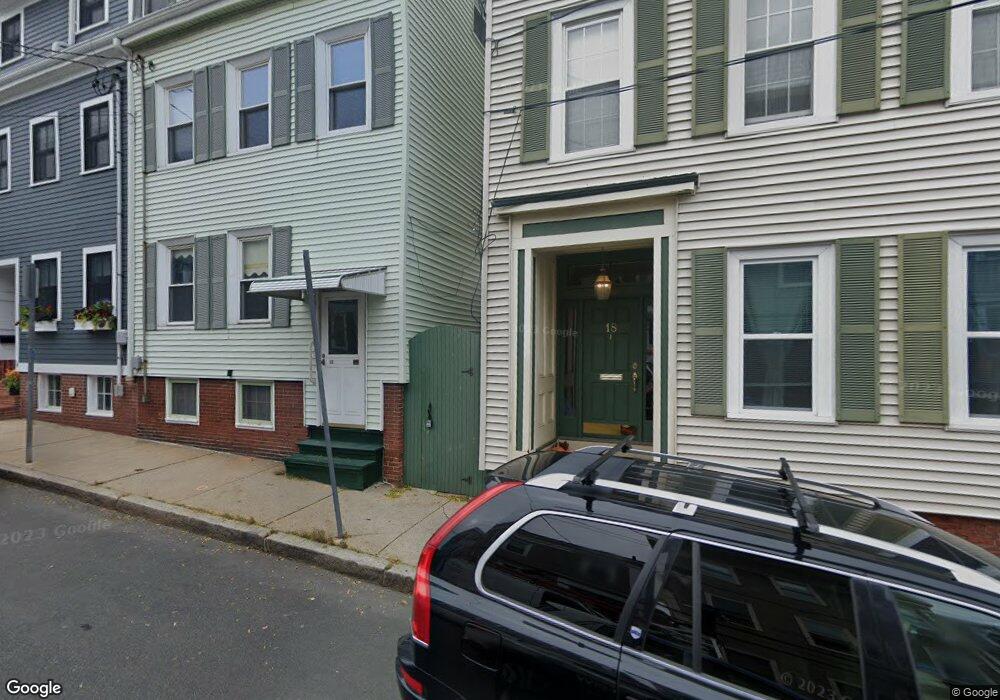
This home is located at 16 Cook St, Charlestown, MA 02129 and is currently estimated at $811,753, approximately $417 per square foot. 16 Cook St is a home located in Suffolk County with nearby schools including Prospect Hill Academy Upper Elementary Campus.
Ownership History
Date
Name
Owned For
Owner Type
Purchase Details
Closed on
May 10, 2024
Sold by
Winder Tyler
Bought by
Nali Leigh and Nali Kristin
Current Estimated Value
Home Financials for this Owner
Home Financials are based on the most recent Mortgage that was taken out on this home.
Original Mortgage
$350,000
Outstanding Balance
$344,351
Interest Rate
6.79%
Mortgage Type
Purchase Money Mortgage
Estimated Equity
$467,402
Purchase Details
Closed on
Nov 27, 2023
Sold by
Cook St 16 Llc
Bought by
Winder Tyler
Home Financials for this Owner
Home Financials are based on the most recent Mortgage that was taken out on this home.
Original Mortgage
$828,000
Interest Rate
7.63%
Mortgage Type
New Conventional
Purchase Details
Closed on
Aug 14, 2023
Sold by
Cook St 16 Llc
Bought by
Milano Melissa
Home Financials for this Owner
Home Financials are based on the most recent Mortgage that was taken out on this home.
Original Mortgage
$576,000
Interest Rate
6.71%
Mortgage Type
Purchase Money Mortgage
Purchase Details
Closed on
Dec 20, 2021
Sold by
16 Cook Street Llc
Bought by
Cook St 16 Llc
Home Financials for this Owner
Home Financials are based on the most recent Mortgage that was taken out on this home.
Original Mortgage
$1,340,000
Interest Rate
2.98%
Mortgage Type
Purchase Money Mortgage
Purchase Details
Closed on
Aug 6, 2021
Sold by
Hughes Patricia A and Hughes Richard A
Bought by
16 Cook St Llc
Purchase Details
Closed on
Sep 29, 2004
Sold by
Hughes Patricia A and Kane Patricia A
Bought by
Hughes Eileen M and Hughes Joseph P
Create a Home Valuation Report for This Property
The Home Valuation Report is an in-depth analysis detailing your home's value as well as a comparison with similar homes in the area
Home Values in the Area
Average Home Value in this Area
Purchase History
| Date | Buyer | Sale Price | Title Company |
|---|---|---|---|
| Nali Leigh | $1,015,000 | None Available | |
| Nali Leigh | $1,015,000 | None Available | |
| Nali Leigh | $1,015,000 | None Available | |
| Winder Tyler | -- | None Available | |
| Winder Tyler | -- | None Available | |
| Winder Tyler | -- | None Available | |
| Milano Melissa | $720,000 | None Available | |
| Milano Melissa | $720,000 | None Available | |
| Milano Melissa | $720,000 | None Available | |
| Cook St 16 Llc | $890,000 | None Available | |
| Cook St 16 Llc | $890,000 | None Available | |
| Cook St 16 Llc | $890,000 | None Available | |
| 16 Cook St Llc | $800,000 | None Available | |
| 16 Cook St Llc | $800,000 | None Available | |
| 16 Cook St Llc | $800,000 | None Available | |
| Hughes Eileen M | -- | -- | |
| Hughes Eileen M | -- | -- |
Source: Public Records
Mortgage History
| Date | Status | Borrower | Loan Amount |
|---|---|---|---|
| Open | Nali Leigh | $350,000 | |
| Closed | Nali Leigh | $350,000 | |
| Previous Owner | Winder Tyler | $828,000 | |
| Previous Owner | Milano Melissa | $576,000 | |
| Previous Owner | Cook St 16 Llc | $1,340,000 |
Source: Public Records
Tax History Compared to Growth
Tax History
| Year | Tax Paid | Tax Assessment Tax Assessment Total Assessment is a certain percentage of the fair market value that is determined by local assessors to be the total taxable value of land and additions on the property. | Land | Improvement |
|---|---|---|---|---|
| 2025 | $6,797 | $0 | $0 | $0 |
| 2024 | $6,797 | $623,600 | $166,900 | $456,700 |
| 2023 | $7,840 | $730,000 | $309,100 | $420,900 |
| 2022 | $7,183 | $660,200 | $279,500 | $380,700 |
| 2021 | $6,708 | $628,700 | $266,200 | $362,500 |
| 2020 | $6,046 | $572,500 | $268,400 | $304,100 |
| 2019 | $5,484 | $520,315 | $207,195 | $313,120 |
| 2018 | $5,095 | $486,210 | $207,195 | $279,015 |
| 2017 | $5,149 | $486,210 | $207,195 | $279,015 |
| 2016 | $5,118 | $465,300 | $218,100 | $247,200 |
| 2015 | $4,839 | $399,600 | $189,500 | $210,100 |
| 2014 | $4,481 | $356,200 | $189,500 | $166,700 |
Source: Public Records
Map
Nearby Homes
- 255 Bunker Hill St Unit 2
- 270 Bunker Hill St Unit 4
- 9 Russell St Unit 2
- 9 Russell St Unit 1
- 15 Russell St
- 56 Belmont St Unit 1
- 64 Walker St Unit 66
- 254-256 Medford St Unit 2
- 207 Bunker Hill St Unit 2
- 24 N Mead St
- 29 Eden St Unit 3
- 172 Bunker Hill St Unit 1
- 364 Bunker Hill St Unit 1
- 40 Chappie St Unit 1
- 56 High St Unit 3
- 9 Armory St
- 46 High St
- 106 Bunker Hill St Unit 6
- 106 Bunker Hill St Unit 1
- 106 Bunker Hill St Unit 4P
- 16 Cook St Unit 2
- 14 Cook St
- 14 Cook St Unit 1
- 18 Cook St
- 18 Cook St Unit 3
- 18 Cook St Unit 1
- 18 Cook St Unit 2
- 10 Cook St Unit 12A
- 20 Cook St Unit 2
- 20 Cook St
- 20 Cook St Unit 20
- 20 Cook St Unit 3
- 15 Sheafe St Unit 17
- 2 Sheafe St
- 24 Cook St
- 24 Cook St Unit 24
- 24 Cook St Unit 2
- 19 Cook St
- 21 Cook St Unit 2
- 21 Cook St Unit 1