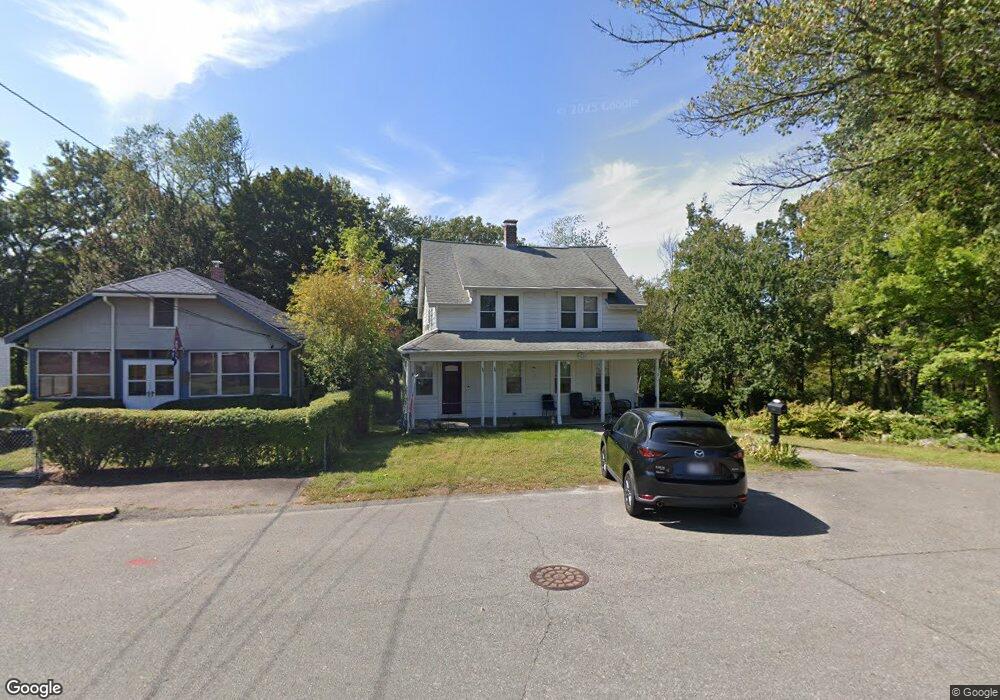
16 Crawford St Braintree, MA 02184
South Braintree NeighborhoodEstimated Value: $614,000 - $736,000
3
Beds
1
Bath
1,340
Sq Ft
$507/Sq Ft
Est. Value
About This Home
This home is located at 16 Crawford St, Braintree, MA 02184 and is currently estimated at $679,006, approximately $506 per square foot. 16 Crawford St is a home located in Norfolk County with nearby schools including Braintree High School, Step Ahead Kindergarten, and Thayer Academy.
Ownership History
Date
Name
Owned For
Owner Type
Purchase Details
Closed on
Jan 29, 1997
Sold by
Est Bailey Miriam E and Bailey Gdn Robert J
Bought by
Burton Jeffrey F
Current Estimated Value
Home Financials for this Owner
Home Financials are based on the most recent Mortgage that was taken out on this home.
Original Mortgage
$113,050
Interest Rate
7.65%
Mortgage Type
Purchase Money Mortgage
Create a Home Valuation Report for This Property
The Home Valuation Report is an in-depth analysis detailing your home's value as well as a comparison with similar homes in the area
Home Values in the Area
Average Home Value in this Area
Purchase History
| Date | Buyer | Sale Price | Title Company |
|---|---|---|---|
| Burton Jeffrey F | $119,000 | -- | |
| Burton Jeffrey F | $119,000 | -- |
Source: Public Records
Mortgage History
| Date | Status | Borrower | Loan Amount |
|---|---|---|---|
| Open | Burton Jeffrey F | $114,000 | |
| Closed | Burton Jeffrey F | $113,050 |
Source: Public Records
Tax History
| Year | Tax Paid | Tax Assessment Tax Assessment Total Assessment is a certain percentage of the fair market value that is determined by local assessors to be the total taxable value of land and additions on the property. | Land | Improvement |
|---|---|---|---|---|
| 2025 | $5,968 | $598,000 | $357,700 | $240,300 |
| 2024 | $5,446 | $574,500 | $337,300 | $237,200 |
| 2023 | $5,080 | $520,500 | $296,400 | $224,100 |
| 2022 | $4,874 | $489,800 | $265,700 | $224,100 |
| 2021 | $4,540 | $456,300 | $245,300 | $211,000 |
| 2020 | $4,107 | $416,500 | $214,600 | $201,900 |
| 2019 | $3,977 | $394,200 | $204,400 | $189,800 |
| 2018 | $3,695 | $350,600 | $168,600 | $182,000 |
| 2017 | $3,488 | $324,800 | $153,300 | $171,500 |
| 2016 | $3,488 | $317,700 | $153,300 | $164,400 |
| 2015 | $3,384 | $305,700 | $147,200 | $158,500 |
| 2014 | $3,194 | $279,700 | $132,900 | $146,800 |
Source: Public Records
Map
Nearby Homes
- 418 John Mahar Hwy Unit 408
- 422 John Mahar Hwy Unit 408
- 426 John Mahar Hwy Unit 311
- 426 John Mahar Hwy Unit 406
- 5 Woodsum Dr Unit 12
- 6 Franklin St
- 564 Middle St
- 145 Hancock St Unit 307
- 145 Hancock St Unit 201
- 31 Doris Rd
- 43 Grove Cir
- 36 Chestnut Ave
- 50 Cleveland Ave
- 44 Shepard Rd
- 491 Washington St Unit 1
- 469-471 Washington St
- 18 Royal Lake Dr Unit 3
- 14 Hillside Rd
- 255 River St
- 972 Liberty St
- 14 Crawford St
- 15 Crawford St
- 12 Crawford St
- 11 Crawford St
- 63 Crawford Rd
- 234 Pearl St
- 238 Pearl St
- 59 Crawford Rd
- 248 Pearl St
- 248 Pearl St
- 55 Crawford Rd
- 48 Crawford Rd
- 252 Pearl St
- 42 Crawford Rd
- 51 Crawford Rd
- 215 Pearl St
- 215 Pearl St Unit Second Floor
- 215 Pearl St Unit Duplex Penthouse
- 215 Pearl St Unit 215 Pearl 2
- 40 Crawford Rd
Your Personal Tour Guide
Ask me questions while you tour the home.