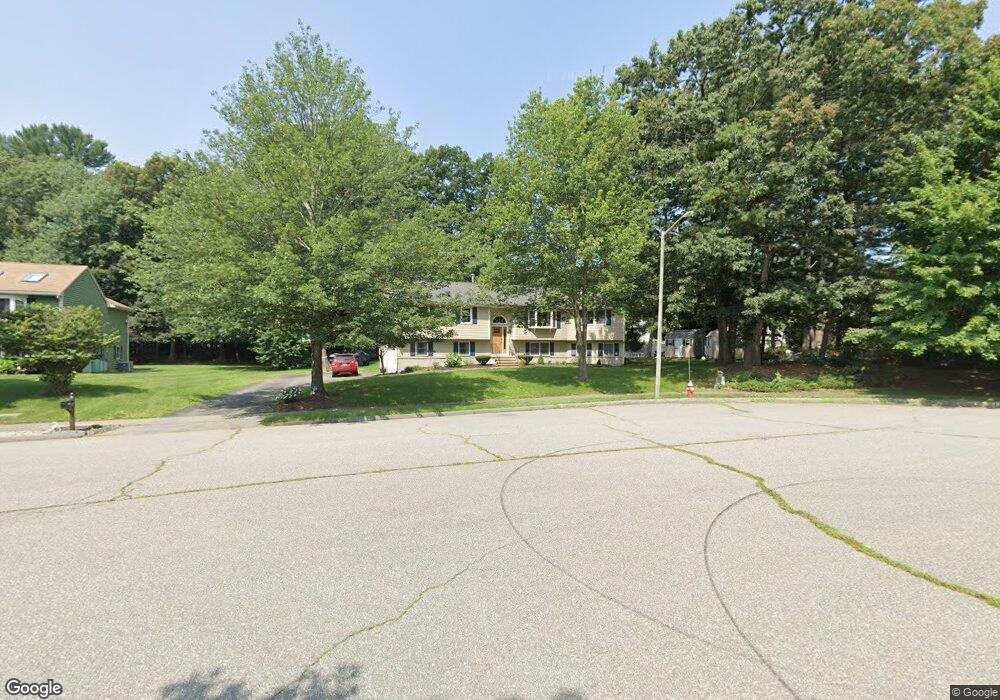
16 Cushing Dr Wilmington, MA 01887
Estimated Value: $833,000 - $1,032,000
4
Beds
2
Baths
1,598
Sq Ft
$565/Sq Ft
Est. Value
About This Home
This home is located at 16 Cushing Dr, Wilmington, MA 01887 and is currently estimated at $902,178, approximately $564 per square foot. 16 Cushing Dr is a home located in Middlesex County with nearby schools including Wilmington Middle School, Wilmington High School, and Abundant Life Christian School and Childcare.
Ownership History
Date
Name
Owned For
Owner Type
Purchase Details
Closed on
Aug 8, 2017
Sold by
Fox Steven J and Fox Colleen A
Bought by
Fox Colleen A
Current Estimated Value
Home Financials for this Owner
Home Financials are based on the most recent Mortgage that was taken out on this home.
Original Mortgage
$345,000
Outstanding Balance
$286,229
Interest Rate
3.75%
Mortgage Type
Adjustable Rate Mortgage/ARM
Estimated Equity
$615,949
Purchase Details
Closed on
Jun 26, 2000
Sold by
Evers Patricia A and Evers Bernard A
Bought by
Fox Steven J
Home Financials for this Owner
Home Financials are based on the most recent Mortgage that was taken out on this home.
Original Mortgage
$226,300
Interest Rate
8.48%
Mortgage Type
Purchase Money Mortgage
Purchase Details
Closed on
Nov 18, 1991
Sold by
Northeastern Dev Corp
Bought by
Evers Patricia and Bernard Evers Jr
Create a Home Valuation Report for This Property
The Home Valuation Report is an in-depth analysis detailing your home's value as well as a comparison with similar homes in the area
Purchase History
| Date | Buyer | Sale Price | Title Company |
|---|---|---|---|
| Fox Colleen A | -- | -- | |
| Fox Steven J | $282,900 | -- | |
| Evers Patricia | $174,900 | -- |
Source: Public Records
Mortgage History
| Date | Status | Borrower | Loan Amount |
|---|---|---|---|
| Open | Fox Colleen A | $345,000 | |
| Previous Owner | Evers Patricia | $250,000 | |
| Previous Owner | Evers Patricia | $235,000 | |
| Previous Owner | Evers Patricia | $226,300 |
Source: Public Records
Tax History
| Year | Tax Paid | Tax Assessment Tax Assessment Total Assessment is a certain percentage of the fair market value that is determined by local assessors to be the total taxable value of land and additions on the property. | Land | Improvement |
|---|---|---|---|---|
| 2025 | $8,526 | $744,600 | $316,800 | $427,800 |
| 2024 | $8,444 | $738,800 | $316,800 | $422,000 |
| 2023 | $8,172 | $684,400 | $288,000 | $396,400 |
| 2022 | $7,861 | $603,300 | $239,900 | $363,400 |
| 2021 | $7,792 | $563,000 | $218,100 | $344,900 |
| 2020 | $7,999 | $589,000 | $218,100 | $370,900 |
| 2019 | $7,393 | $537,700 | $207,700 | $330,000 |
| 2018 | $6,937 | $481,400 | $197,800 | $283,600 |
| 2017 | $6,803 | $470,800 | $197,800 | $273,000 |
| 2016 | $6,442 | $440,300 | $188,500 | $251,800 |
| 2015 | $6,113 | $425,400 | $188,500 | $236,900 |
| 2014 | $5,750 | $403,800 | $179,600 | $224,200 |
Source: Public Records
Map
Nearby Homes
Your Personal Tour Guide
Ask me questions while you tour the home.