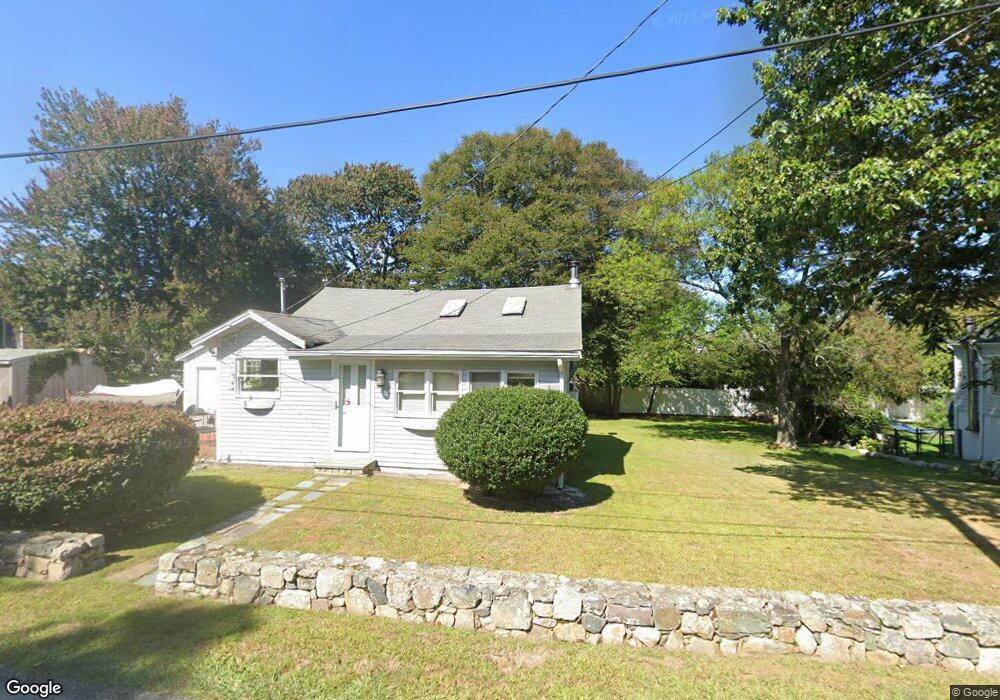
16 Dayton Rd Scituate, MA 02066
Estimated Value: $569,000 - $694,000
2
Beds
1
Bath
780
Sq Ft
$800/Sq Ft
Est. Value
About This Home
This home is located at 16 Dayton Rd, Scituate, MA 02066 and is currently estimated at $624,220, approximately $800 per square foot. 16 Dayton Rd is a home located in Plymouth County with nearby schools including Wampatuck Elementary School, Lester J. Gates Middle School, and Scituate High School.
Ownership History
Date
Name
Owned For
Owner Type
Purchase Details
Closed on
Feb 17, 2006
Sold by
Rourke Margaret T and Singleton Ann M
Bought by
Thompson Michael
Current Estimated Value
Purchase Details
Closed on
Jan 24, 1995
Sold by
Smith Matthew R
Bought by
Singleton Ann M
Home Financials for this Owner
Home Financials are based on the most recent Mortgage that was taken out on this home.
Original Mortgage
$123,400
Interest Rate
9.16%
Mortgage Type
Purchase Money Mortgage
Purchase Details
Closed on
Jan 31, 1991
Sold by
Saleski Douglas R and Saleski Kenneth A
Bought by
Smith Matthew R
Home Financials for this Owner
Home Financials are based on the most recent Mortgage that was taken out on this home.
Original Mortgage
$93,000
Interest Rate
9.52%
Mortgage Type
Purchase Money Mortgage
Create a Home Valuation Report for This Property
The Home Valuation Report is an in-depth analysis detailing your home's value as well as a comparison with similar homes in the area
Home Values in the Area
Average Home Value in this Area
Purchase History
| Date | Buyer | Sale Price | Title Company |
|---|---|---|---|
| Thompson Michael | $315,000 | -- | |
| Singleton Ann M | $129,900 | -- | |
| Smith Matthew R | $107,092 | -- |
Source: Public Records
Mortgage History
| Date | Status | Borrower | Loan Amount |
|---|---|---|---|
| Previous Owner | Smith Matthew R | $125,000 | |
| Previous Owner | Smith Matthew R | $123,400 | |
| Previous Owner | Smith Matthew R | $93,000 |
Source: Public Records
Tax History
| Year | Tax Paid | Tax Assessment Tax Assessment Total Assessment is a certain percentage of the fair market value that is determined by local assessors to be the total taxable value of land and additions on the property. | Land | Improvement |
|---|---|---|---|---|
| 2025 | $5,207 | $521,200 | $397,300 | $123,900 |
| 2024 | $5,001 | $482,700 | $361,200 | $121,500 |
| 2023 | $4,688 | $436,900 | $328,400 | $108,500 |
| 2022 | $4,688 | $371,500 | $275,200 | $96,300 |
| 2021 | $3,930 | $294,800 | $249,000 | $45,800 |
| 2020 | $3,853 | $285,400 | $239,400 | $46,000 |
| 2019 | $3,853 | $280,400 | $234,700 | $45,700 |
| 2018 | $4,163 | $298,400 | $250,300 | $48,100 |
| 2017 | $4,057 | $287,900 | $239,800 | $48,100 |
| 2016 | $3,777 | $267,100 | $219,000 | $48,100 |
| 2015 | $3,361 | $256,600 | $208,500 | $48,100 |
Source: Public Records
Map
Nearby Homes
- 3 Egypt Ave
- 54 Woodland Rd
- 92 Marion Rd
- 59 Captain Peirce Rd
- 33 Oceanside Dr
- 430 Hatherly Rd
- 430 Hatherly Rd Unit Exhibit “A”
- 430 Hatherly Rd Unit Exhibit “B”
- 23 Oceanside Dr
- 49 Jackson Rd
- 86 Hatherly Rd
- 74 Branch St Unit 15
- 20 Lawson Rd
- 20 Lee Ave
- 38 Lauren Ln
- 49 Whittier Dr
- 1 Washington Ln
- 124 Captain Peirce Rd
- 32 Barker Rd Unit 3
- 11 Brookline Rd
Your Personal Tour Guide
Ask me questions while you tour the home.