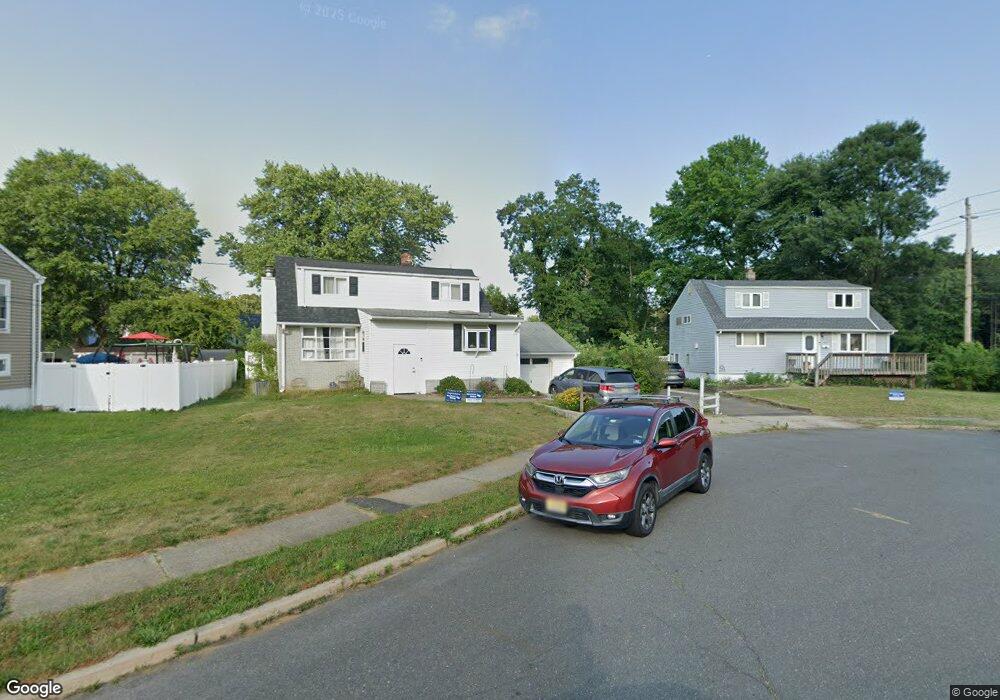
16 Denise Ct Old Bridge, NJ 08857
Estimated Value: $560,000 - $579,950
3
Beds
2
Baths
1,300
Sq Ft
$441/Sq Ft
Est. Value
About This Home
This home is located at 16 Denise Ct, Old Bridge, NJ 08857 and is currently estimated at $573,488, approximately $441 per square foot. 16 Denise Ct is a home located in Middlesex County with nearby schools including Old Bridge High School, St. Thomas the Apostle School, and Immaculate Conception School.
Ownership History
Date
Name
Owned For
Owner Type
Purchase Details
Closed on
Oct 27, 2011
Sold by
Cavasin Joseph and Cavasin Evelyn
Bought by
Kondratowicz Dariusz and Mace Crystal
Current Estimated Value
Home Financials for this Owner
Home Financials are based on the most recent Mortgage that was taken out on this home.
Original Mortgage
$227,250
Outstanding Balance
$153,642
Interest Rate
3.92%
Mortgage Type
FHA
Estimated Equity
$419,846
Create a Home Valuation Report for This Property
The Home Valuation Report is an in-depth analysis detailing your home's value as well as a comparison with similar homes in the area
Home Values in the Area
Average Home Value in this Area
Purchase History
| Date | Buyer | Sale Price | Title Company |
|---|---|---|---|
| Kondratowicz Dariusz | $252,000 | Fidelity Natl Title Ins Co |
Source: Public Records
Mortgage History
| Date | Status | Borrower | Loan Amount |
|---|---|---|---|
| Open | Kondratowicz Dariusz | $227,250 |
Source: Public Records
Tax History Compared to Growth
Tax History
| Year | Tax Paid | Tax Assessment Tax Assessment Total Assessment is a certain percentage of the fair market value that is determined by local assessors to be the total taxable value of land and additions on the property. | Land | Improvement |
|---|---|---|---|---|
| 2025 | $7,334 | $134,300 | $45,300 | $89,000 |
| 2024 | $7,025 | $134,300 | $45,300 | $89,000 |
| 2023 | $7,025 | $134,300 | $45,300 | $89,000 |
| 2022 | $6,859 | $134,300 | $45,300 | $89,000 |
| 2021 | $5,030 | $134,300 | $45,300 | $89,000 |
| 2020 | $6,649 | $134,300 | $45,300 | $89,000 |
| 2019 | $6,782 | $134,300 | $45,300 | $89,000 |
| 2018 | $6,457 | $134,300 | $45,300 | $89,000 |
| 2017 | $6,239 | $134,300 | $45,300 | $89,000 |
| 2016 | $6,355 | $134,300 | $45,300 | $89,000 |
| 2015 | $5,995 | $134,300 | $45,300 | $89,000 |
| 2014 | $5,932 | $134,300 | $45,300 | $89,000 |
Source: Public Records
Map
Nearby Homes
- 44 Shirley Blvd
- 37 Shirley Blvd
- 35 Birch St
- 14 Brookside Ave
- 5 Elaine Ct
- 17 Birch St
- 1210 Englishtown Rd
- 306 Austin Ave
- 98 Madison Ave
- 1122 Marlboro Rd
- 65 Bentley Ave
- 19 Huxley Dr
- 269 Park Ave
- 326 Marlboro Rd
- 296 Herbert Ave
- 24 Kensington Ave
- 23 Orchard Dr
- 111 Applegate Ave
- 76 Appleby Ave
- 21 Fourth St