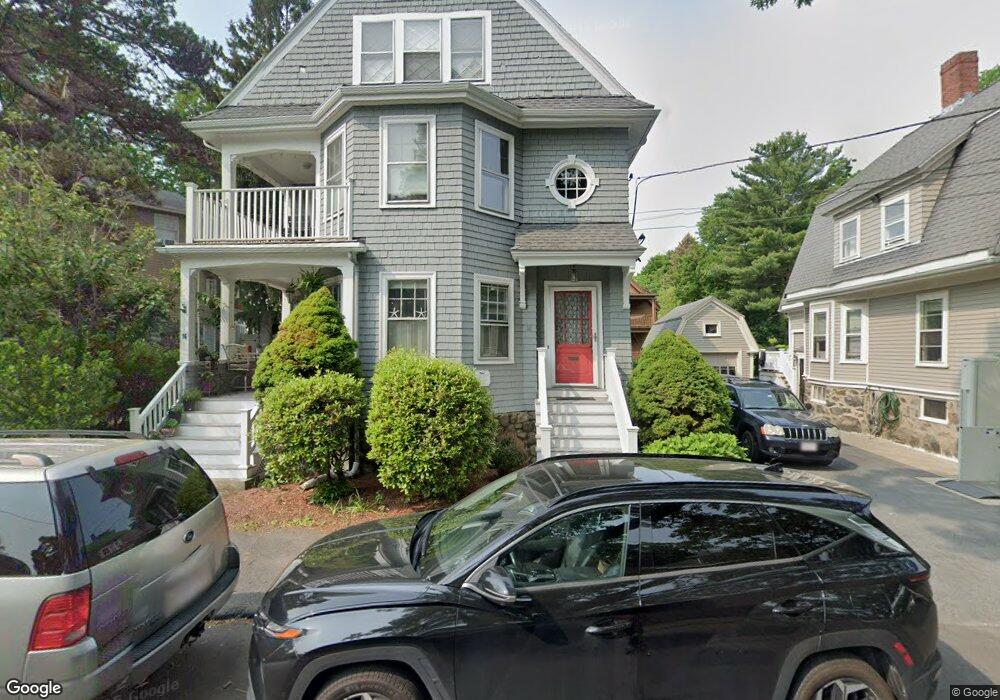
16 Devens Rd Swampscott, MA 01907
Estimated Value: $631,000 - $820,000
3
Beds
2
Baths
1,674
Sq Ft
$413/Sq Ft
Est. Value
About This Home
This home is located at 16 Devens Rd, Swampscott, MA 01907 and is currently estimated at $690,957, approximately $412 per square foot. 16 Devens Rd is a home located in Essex County with nearby schools including Swampscott Middle School and Swampscott High School.
Ownership History
Date
Name
Owned For
Owner Type
Purchase Details
Closed on
Dec 7, 2017
Sold by
Welch Lawrence G
Bought by
Lawrence G Welch Ret
Current Estimated Value
Purchase Details
Closed on
Feb 5, 2007
Sold by
Elder Deborah A and Stepanian Deborah Elder
Bought by
Welch Lawrence G
Home Financials for this Owner
Home Financials are based on the most recent Mortgage that was taken out on this home.
Original Mortgage
$290,400
Interest Rate
6.16%
Mortgage Type
Purchase Money Mortgage
Purchase Details
Closed on
Apr 13, 2005
Sold by
Elder-Stepanian Deborah
Bought by
Elder Deborah A
Purchase Details
Closed on
Jul 17, 2002
Sold by
Lamontagne John and Wallace Barbara
Bought by
Stepanian Deborah E
Purchase Details
Closed on
Jul 13, 2000
Sold by
Rubin Steven M
Bought by
Lamontagne John and Wallace Barabra
Purchase Details
Closed on
Feb 28, 1997
Sold by
Keough James L and Cartotto Karen L
Bought by
Rubin Steven M
Purchase Details
Closed on
Jun 3, 1992
Sold by
Cawlina Michael J and Cawlina Andrea M
Bought by
Keough James L and Cartotto Karen L
Create a Home Valuation Report for This Property
The Home Valuation Report is an in-depth analysis detailing your home's value as well as a comparison with similar homes in the area
Home Values in the Area
Average Home Value in this Area
Purchase History
| Date | Buyer | Sale Price | Title Company |
|---|---|---|---|
| Lawrence G Welch Ret | -- | -- | |
| Welch Lawrence G | $363,000 | -- | |
| Elder Deborah A | -- | -- | |
| Stepanian Deborah E | $289,000 | -- | |
| Lamontagne John | $240,000 | -- | |
| Rubin Steven M | $163,900 | -- | |
| Keough James L | $155,000 | -- |
Source: Public Records
Mortgage History
| Date | Status | Borrower | Loan Amount |
|---|---|---|---|
| Previous Owner | Keough James L | $266,000 | |
| Previous Owner | Keough James L | $290,400 |
Source: Public Records
Tax History Compared to Growth
Tax History
| Year | Tax Paid | Tax Assessment Tax Assessment Total Assessment is a certain percentage of the fair market value that is determined by local assessors to be the total taxable value of land and additions on the property. | Land | Improvement |
|---|---|---|---|---|
| 2025 | $6,846 | $596,900 | $0 | $596,900 |
| 2024 | $6,162 | $536,300 | $0 | $536,300 |
| 2023 | $5,777 | $492,100 | $0 | $492,100 |
| 2022 | $5,663 | $441,400 | $0 | $441,400 |
| 2021 | $5,599 | $405,700 | $0 | $405,700 |
| 2020 | $5,591 | $391,000 | $0 | $391,000 |
| 2019 | $5,353 | $352,200 | $0 | $352,200 |
| 2018 | $5,635 | $352,200 | $0 | $352,200 |
| 2017 | $5,914 | $338,900 | $0 | $338,900 |
| 2016 | $5,873 | $338,900 | $0 | $338,900 |
| 2015 | $5,493 | $320,300 | $0 | $320,300 |
| 2014 | $5,866 | $313,700 | $0 | $313,700 |
Source: Public Records
Map
Nearby Homes
- 71 Greenwood Ave Unit 306
- 71 Greenwood Ave Unit 207
- 51 Mountwood Rd
- 40 Andrew Rd
- 306 Paradise Rd
- 58 Magnolia Rd
- 75 Bay View Dr
- 71 Walnut Rd
- 106 Norfolk Ave
- 64 Stetson Ave
- 80 Norfolk Ave Unit 1
- 189 Burrill St Unit 2
- 28 Claremont Terrace Unit 6
- 146 Burrill St
- 11 Boynton St Unit 104
- 11 Boynton St Unit 102
- 11 Boynton St Unit 204
- 51 New Ocean St Unit 2
- 7-9 Rock Ave
- 29-31 Essex Ave Unit 2