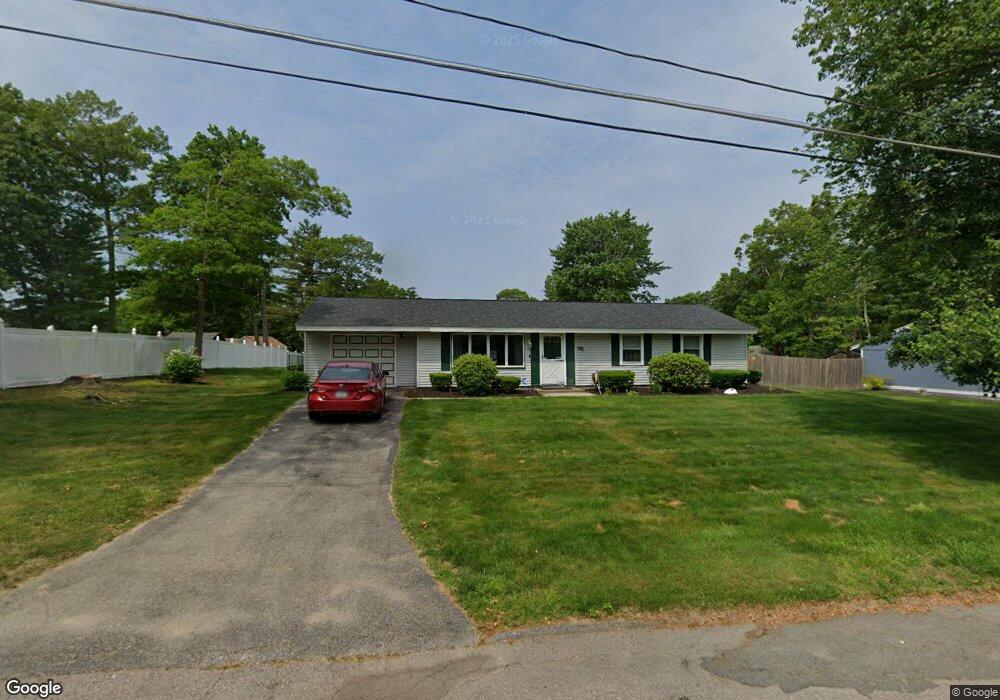
16 Dondi Rd Brockton, MA 02302
Estimated Value: $444,317 - $498,000
4
Beds
1
Bath
1,104
Sq Ft
$433/Sq Ft
Est. Value
About This Home
This home is located at 16 Dondi Rd, Brockton, MA 02302 and is currently estimated at $477,579, approximately $432 per square foot. 16 Dondi Rd is a home located in Plymouth County with nearby schools including Gilmore Elementary School, Davis K-8 School, and John F. Kennedy Elementary School.
Ownership History
Date
Name
Owned For
Owner Type
Purchase Details
Closed on
Jun 26, 2020
Sold by
Cambridge George A and Cambridge Joanna
Bought by
Cambridge Joanna S
Current Estimated Value
Home Financials for this Owner
Home Financials are based on the most recent Mortgage that was taken out on this home.
Original Mortgage
$256,500
Outstanding Balance
$226,430
Interest Rate
3.1%
Mortgage Type
New Conventional
Estimated Equity
$251,149
Purchase Details
Closed on
Jun 4, 2007
Sold by
Cambridge George A and Cambridge Viola M
Bought by
Cambridge George A and Cambridge Viola M
Create a Home Valuation Report for This Property
The Home Valuation Report is an in-depth analysis detailing your home's value as well as a comparison with similar homes in the area
Purchase History
| Date | Buyer | Sale Price | Title Company |
|---|---|---|---|
| Cambridge Joanna S | -- | Misc Company | |
| Cambridge George A | -- | -- |
Source: Public Records
Mortgage History
| Date | Status | Borrower | Loan Amount |
|---|---|---|---|
| Open | Cambridge Joanna S | $256,500 | |
| Previous Owner | Cambridge George A | $247,691 |
Source: Public Records
Tax History
| Year | Tax Paid | Tax Assessment Tax Assessment Total Assessment is a certain percentage of the fair market value that is determined by local assessors to be the total taxable value of land and additions on the property. | Land | Improvement |
|---|---|---|---|---|
| 2025 | $4,622 | $381,700 | $163,400 | $218,300 |
| 2024 | $4,570 | $380,200 | $163,400 | $216,800 |
| 2023 | $4,348 | $335,000 | $113,800 | $221,200 |
| 2022 | $4,166 | $298,200 | $103,400 | $194,800 |
| 2021 | $4,040 | $278,600 | $97,000 | $181,600 |
| 2020 | $3,994 | $263,600 | $84,700 | $178,900 |
| 2019 | $3,594 | $231,300 | $81,300 | $150,000 |
| 2018 | $3,544 | $220,700 | $81,300 | $139,400 |
| 2017 | $2,975 | $184,800 | $81,300 | $103,500 |
| 2016 | $3,217 | $185,300 | $77,500 | $107,800 |
| 2015 | $2,995 | $165,000 | $77,500 | $87,500 |
| 2014 | $2,962 | $163,400 | $77,500 | $85,900 |
Source: Public Records
Map
Nearby Homes
- 23 Dondi Rd
- 118 Deanna Rd
- 15 Wachusetts Rd
- 12 Paulin Ave
- 578 Plain St
- 549 Summer St
- 111 Riverview St
- 383 Summer St
- 1 Thomas Cir
- 41 Riverview St
- 100 Concord St
- 231 Winter St
- 4 Virginia Ave
- 107 N Leyden St
- 55 Marjan Dr
- 223 Clinton St Unit 16
- 15 Longworth Ave Unit 226
- 35 Longworth Ave Unit 25
- 25 Longworth Ave Unit 4
- 9 Longworth Ave Unit 135
Your Personal Tour Guide
Ask me questions while you tour the home.