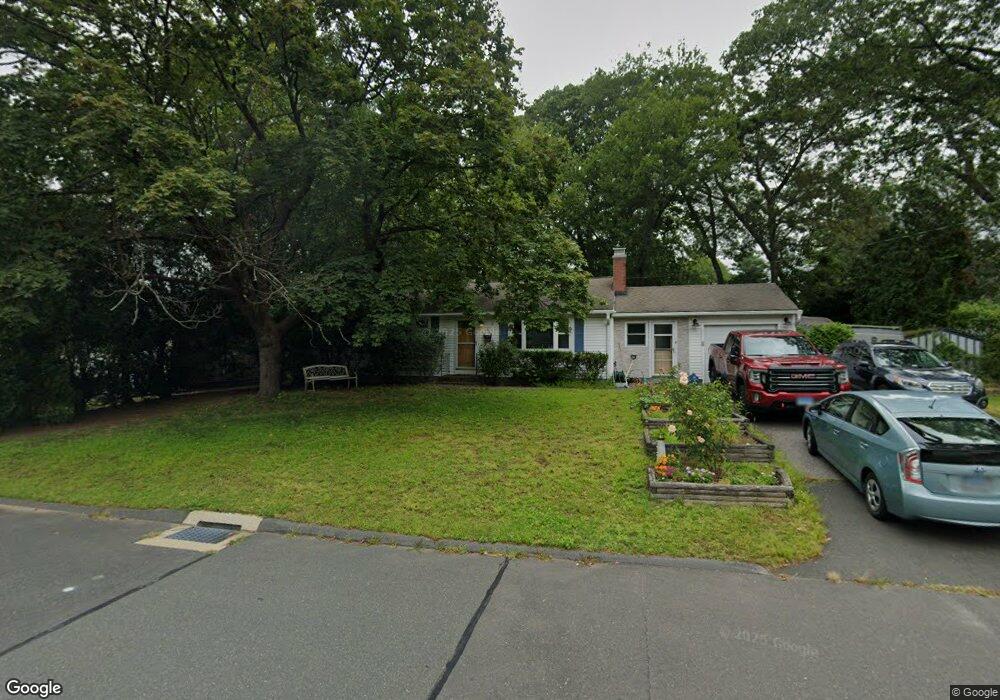
16 Donna St Enfield, CT 06082
Estimated Value: $300,000 - $337,000
3
Beds
2
Baths
1,056
Sq Ft
$304/Sq Ft
Est. Value
About This Home
This home is located at 16 Donna St, Enfield, CT 06082 and is currently estimated at $321,127, approximately $304 per square foot. 16 Donna St is a home located in Hartford County with nearby schools including Eli Whitney Elementary School, Hazardville Memorial Elementary School, and Enfield High School.
Ownership History
Date
Name
Owned For
Owner Type
Purchase Details
Closed on
Nov 6, 1991
Sold by
Marsloais Rejean and Marsloais M
Bought by
Shaw Robin
Current Estimated Value
Purchase Details
Closed on
Aug 11, 1989
Sold by
Cooney Frederich
Bought by
Marsolais Rejean
Create a Home Valuation Report for This Property
The Home Valuation Report is an in-depth analysis detailing your home's value as well as a comparison with similar homes in the area
Home Values in the Area
Average Home Value in this Area
Purchase History
We collect this data history from publicly available records. To have your information removed, we recommend requesting removal directly through your county’s website.
| Date | Buyer | Sale Price | Title Company |
|---|---|---|---|
| Shaw Robin | $133,900 | -- | |
| Marsolais Rejean | $135,000 | -- |
Source: Public Records
Mortgage History
We collect this data history from publicly available records. To have your information removed, we recommend requesting removal directly through your county’s website.
| Date | Status | Borrower | Loan Amount |
|---|---|---|---|
| Open | Marsolais Rejean | $75,000 | |
| Closed | Marsolais Rejean | $90,000 | |
| Closed | Marsolais Rejean | $95,000 | |
| Closed | Marsolais Rejean | $107,120 |
Source: Public Records
Tax History
| Year | Tax Paid | Tax Assessment Tax Assessment Total Assessment is a certain percentage of the fair market value that is determined by local assessors to be the total taxable value of land and additions on the property. | Land | Improvement |
|---|---|---|---|---|
| 2025 | $5,245 | $149,900 | $57,400 | $92,500 |
| 2024 | $5,104 | $149,900 | $57,400 | $92,500 |
| 2023 | $5,067 | $149,900 | $57,400 | $92,500 |
| 2022 | $4,600 | $149,900 | $57,400 | $92,500 |
| 2021 | $4,423 | $117,840 | $47,570 | $70,270 |
| 2020 | $4,423 | $117,840 | $47,570 | $70,270 |
| 2019 | $4,434 | $117,840 | $47,570 | $70,270 |
| 2018 | $4,360 | $117,840 | $47,570 | $70,270 |
| 2017 | $4,116 | $117,840 | $47,570 | $70,270 |
| 2016 | $3,997 | $116,510 | $48,810 | $67,700 |
| 2015 | $3,873 | $116,510 | $48,810 | $67,700 |
| 2014 | $3,773 | $116,510 | $48,810 | $67,700 |
Source: Public Records
Map
Nearby Homes
Your Personal Tour Guide
Ask me questions while you tour the home.