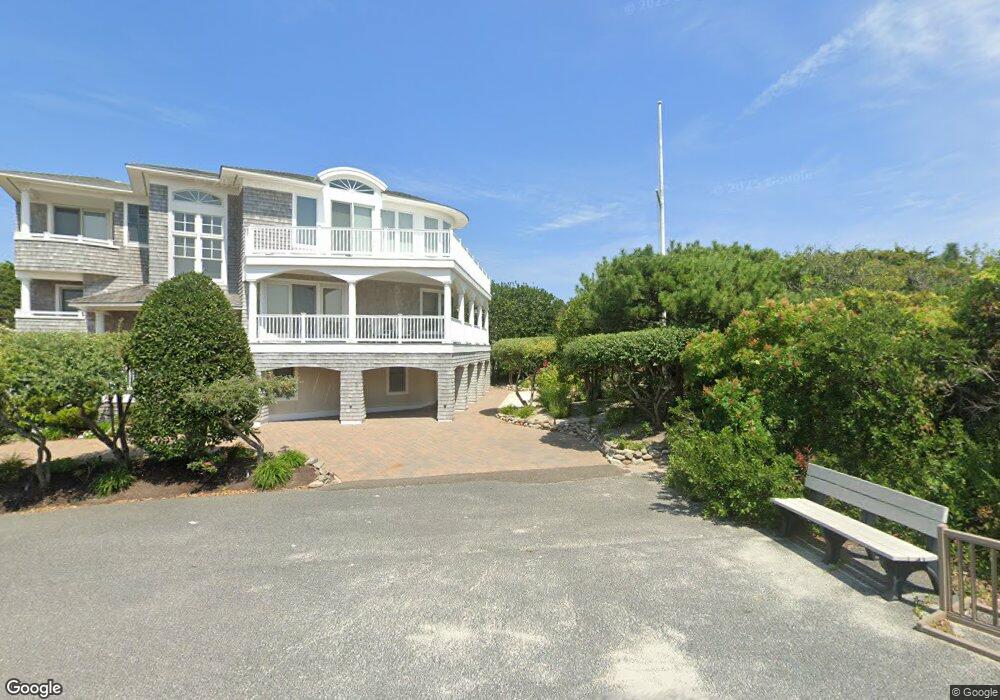
16 E 24th St Barnegat Light, NJ 08006
Long Beach Island NeighborhoodEstimated Value: $3,033,000 - $3,644,000
5
Beds
5
Baths
5,054
Sq Ft
$676/Sq Ft
Est. Value
About This Home
This home is located at 16 E 24th St, Barnegat Light, NJ 08006 and is currently estimated at $3,415,213, approximately $675 per square foot. 16 E 24th St is a home with nearby schools including Ethel A. Jacobsen Elementary School, Long Beach Island Grade School, and Southern Regional Middle School.
Ownership History
Date
Name
Owned For
Owner Type
Purchase Details
Closed on
Apr 1, 2021
Sold by
Passaro Linda C
Bought by
Passaro Linda C and The Linda C Passaro Family Tru
Current Estimated Value
Purchase Details
Closed on
Feb 6, 2014
Sold by
Passaro Linda C
Bought by
Passaro Linda C
Purchase Details
Closed on
Dec 2, 2004
Sold by
Passaro Alfonso J and Passaro Linda C
Bought by
Passaro Alfonso J and Passaro Linda C
Purchase Details
Closed on
Jan 2, 2001
Sold by
Gonzalez Carlos
Bought by
Passaro Alfonso and Passaro Linda
Create a Home Valuation Report for This Property
The Home Valuation Report is an in-depth analysis detailing your home's value as well as a comparison with similar homes in the area
Home Values in the Area
Average Home Value in this Area
Purchase History
| Date | Buyer | Sale Price | Title Company |
|---|---|---|---|
| Passaro Linda C | -- | None Available | |
| Passaro Linda C | -- | None Available | |
| Passaro Alfonso J | -- | -- | |
| Passaro Alfonso | $852,500 | -- | |
| Passaro Alfonso | $852,500 | -- |
Source: Public Records
Tax History
| Year | Tax Paid | Tax Assessment Tax Assessment Total Assessment is a certain percentage of the fair market value that is determined by local assessors to be the total taxable value of land and additions on the property. | Land | Improvement |
|---|---|---|---|---|
| 2025 | $23,651 | $2,346,300 | $1,884,100 | $462,200 |
| 2024 | $20,906 | $2,346,300 | $1,884,100 | $462,200 |
Source: Public Records
Map
Nearby Homes
- 2402 Central Ave
- 2006 Central Ave
- 4 E 20th St
- 10 E 18th St
- 11 E 30th St
- 171 Long Beach Blvd
- 2402-L Central Ave
- 2402 -L- Central Ave
- 41 W Holly Dr
- 43 W Holly Dr
- 29 Amherst Rd
- 34 Amherst Rd
- 24 Beacon Dr
- 46 Adrian Rd
- 3 W 12th St
- 6 Collier Rd
- 704 Broadway
- 129 Long Beach Blvd
- 128 Long Beach Blvd
- 26 Butler Rd
Your Personal Tour Guide
Ask me questions while you tour the home.