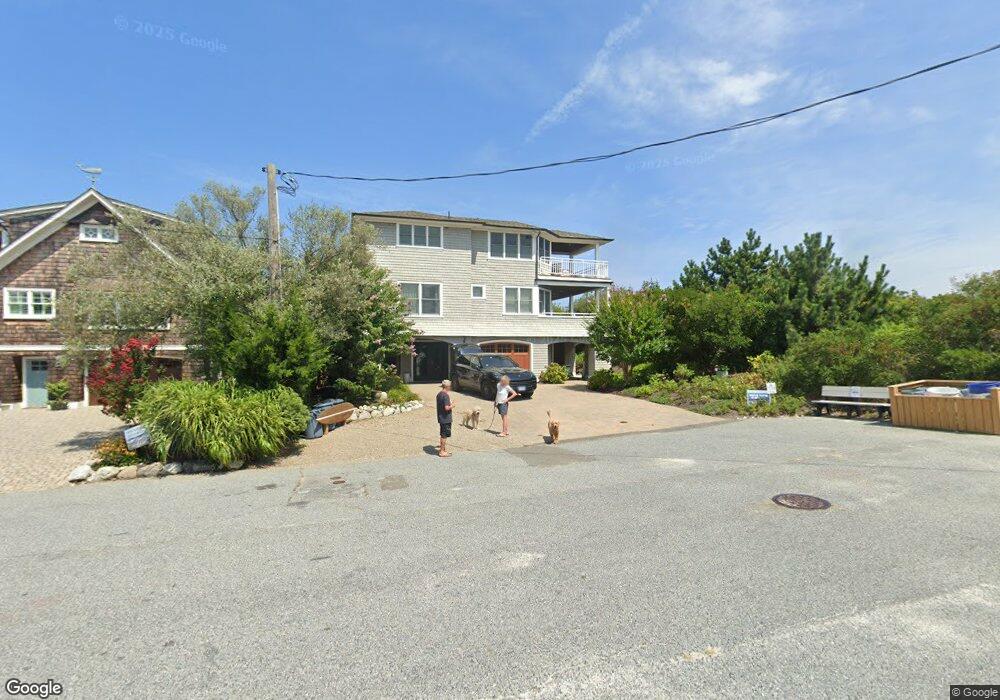
16 E 26th St Barnegat Light, NJ 08006
Long Beach Island NeighborhoodEstimated Value: $2,646,000 - $3,469,537
5
Beds
6
Baths
4,210
Sq Ft
$756/Sq Ft
Est. Value
About This Home
This home is located at 16 E 26th St, Barnegat Light, NJ 08006 and is currently estimated at $3,184,512, approximately $756 per square foot. 16 E 26th St is a home with nearby schools including Ethel A. Jacobsen Elementary School, Long Beach Island Grade School, and Southern Regional Middle School.
Ownership History
Date
Name
Owned For
Owner Type
Purchase Details
Closed on
Feb 27, 2020
Sold by
Schumann William H and The William H Schumann Iii Liv
Bought by
Schumann Barbara A and Schumann Barbra A
Current Estimated Value
Home Financials for this Owner
Home Financials are based on the most recent Mortgage that was taken out on this home.
Original Mortgage
$1,400,000
Outstanding Balance
$1,211,212
Interest Rate
2.8%
Mortgage Type
New Conventional
Estimated Equity
$1,973,300
Purchase Details
Closed on
Dec 29, 2017
Sold by
Schumann Iii Trust
Bought by
Schumann Barbra A
Purchase Details
Closed on
Jun 6, 2013
Sold by
Schumann William H
Bought by
Schumann William H and The William H Schumann Iii Living Trust
Purchase Details
Closed on
Sep 14, 2007
Sold by
Sondak Andrea
Bought by
Schumann William H
Create a Home Valuation Report for This Property
The Home Valuation Report is an in-depth analysis detailing your home's value as well as a comparison with similar homes in the area
Home Values in the Area
Average Home Value in this Area
Purchase History
| Date | Buyer | Sale Price | Title Company |
|---|---|---|---|
| Schumann Barbara A | -- | First American Title Ins Co | |
| Schumann Barbra A | -- | -- | |
| Schumann William H | -- | Commonwealth Land Title Insu | |
| Schumann William H | $2,400,000 | Commonwealth Land Title Insu |
Source: Public Records
Mortgage History
| Date | Status | Borrower | Loan Amount |
|---|---|---|---|
| Open | Schumann Barbara A | $1,400,000 |
Source: Public Records
Tax History
| Year | Tax Paid | Tax Assessment Tax Assessment Total Assessment is a certain percentage of the fair market value that is determined by local assessors to be the total taxable value of land and additions on the property. | Land | Improvement |
|---|---|---|---|---|
| 2025 | $22,176 | $2,200,000 | $1,713,200 | $486,800 |
| 2024 | $19,602 | $2,200,000 | $1,713,200 | $486,800 |
| 2023 | $18,194 | $2,200,000 | $1,713,200 | $486,800 |
| 2022 | $18,194 | $2,200,000 | $1,713,200 | $486,800 |
| 2021 | $18,819 | $2,200,000 | $1,713,200 | $486,800 |
| 2020 | $21,388 | $2,368,600 | $1,814,400 | $554,200 |
| 2019 | $20,607 | $2,368,600 | $1,814,400 | $554,200 |
| 2018 | $20,252 | $2,368,600 | $1,814,400 | $554,200 |
| 2017 | $20,962 | $2,368,600 | $1,814,400 | $554,200 |
| 2016 | $21,279 | $2,468,600 | $1,814,400 | $654,200 |
| 2015 | $20,514 | $2,468,600 | $1,814,400 | $654,200 |
| 2014 | $22,313 | $2,468,200 | $1,814,400 | $653,800 |
Source: Public Records
Map
Nearby Homes
- 2402 Central Ave
- 11 E 30th St
- 2006 Central Ave
- 4 E 20th St
- 171 Long Beach Blvd
- 10 E 18th St
- 41 W Holly Dr
- 43 W Holly Dr
- 24 Beacon Dr
- 2402-L Central Ave
- 2402 -L- Central Ave
- 29 Amherst Rd
- 34 Amherst Rd
- 46 Adrian Rd
- 6 Collier Rd
- 3 W 12th St
- 129 Long Beach Blvd
- 128 Long Beach Blvd
- 704 Broadway
- 26 Butler Rd
Your Personal Tour Guide
Ask me questions while you tour the home.