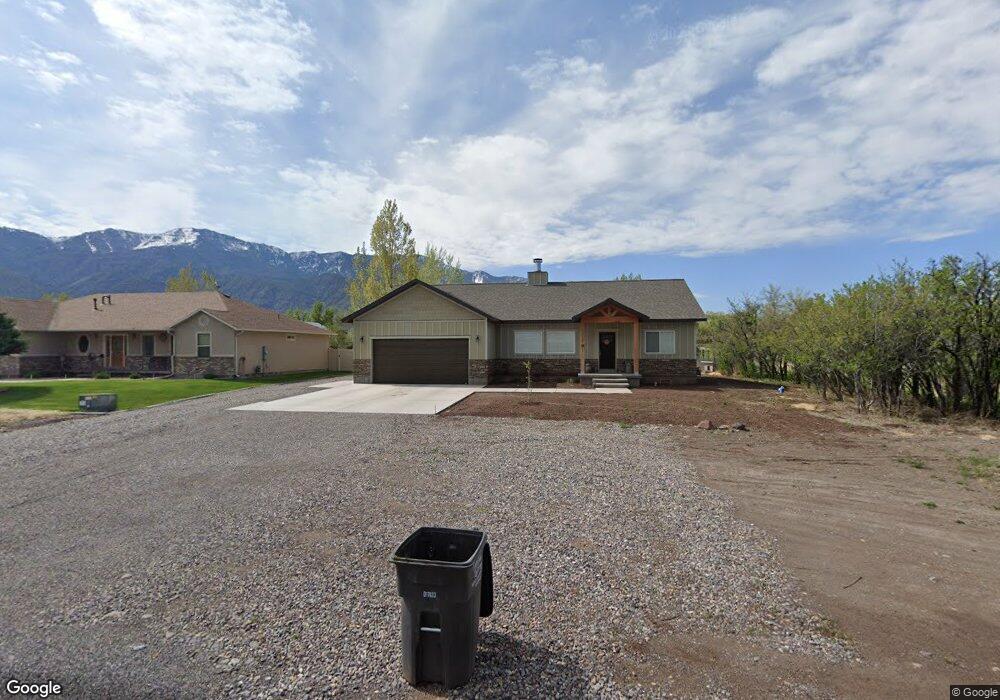
16 E 300 N Unit 5 Annabella, UT 84711
Estimated Value: $465,082 - $528,000
--
Bed
--
Bath
1,722
Sq Ft
$287/Sq Ft
Est. Value
About This Home
This home is located at 16 E 300 N Unit 5, Annabella, UT 84711 and is currently estimated at $494,521, approximately $287 per square foot. 16 E 300 N Unit 5 is a home located in Sevier County with nearby schools including Monroe School, South Sevier Middle School, and South Sevier High School.
Ownership History
Date
Name
Owned For
Owner Type
Purchase Details
Closed on
Feb 17, 2021
Sold by
Olcott Kraygen Lynn and Olcott Mckenzie
Bought by
Olcott Mckenzie and Olcott Kraygen Lynn
Current Estimated Value
Home Financials for this Owner
Home Financials are based on the most recent Mortgage that was taken out on this home.
Original Mortgage
$292,600
Outstanding Balance
$260,870
Interest Rate
2.65%
Mortgage Type
New Conventional
Estimated Equity
$233,651
Purchase Details
Closed on
Mar 16, 2018
Sold by
Olcott Kraygen Lynn
Bought by
Olcott Kraygen Lynn and Olcott Mckenzie
Home Financials for this Owner
Home Financials are based on the most recent Mortgage that was taken out on this home.
Original Mortgage
$18,600
Interest Rate
4.22%
Purchase Details
Closed on
Aug 23, 2006
Sold by
Zundel Mazel Davis
Bought by
Zundel James and Zundel Lori
Create a Home Valuation Report for This Property
The Home Valuation Report is an in-depth analysis detailing your home's value as well as a comparison with similar homes in the area
Home Values in the Area
Average Home Value in this Area
Purchase History
| Date | Buyer | Sale Price | Title Company |
|---|---|---|---|
| Olcott Mckenzie | -- | Professional Title | |
| Olcott Kraygen Lynn | -- | First American Title Insuran | |
| Olcott Kraygen Lynn | -- | First American Title Insuran | |
| Zundel James | -- | D Land Title |
Source: Public Records
Mortgage History
| Date | Status | Borrower | Loan Amount |
|---|---|---|---|
| Open | Olcott Mckenzie | $292,600 | |
| Closed | Olcott Kraygen Lynn | $18,600 |
Source: Public Records
Tax History Compared to Growth
Tax History
| Year | Tax Paid | Tax Assessment Tax Assessment Total Assessment is a certain percentage of the fair market value that is determined by local assessors to be the total taxable value of land and additions on the property. | Land | Improvement |
|---|---|---|---|---|
| 2024 | $1,981 | $247,863 | $39,433 | $208,430 |
| 2023 | $2,094 | $252,436 | $32,902 | $219,534 |
| 2022 | $2,052 | $211,413 | $28,979 | $182,434 |
| 2021 | $2,066 | $177,001 | $24,006 | $152,995 |
| 2020 | $600 | $48,530 | $21,824 | $26,706 |
| 2019 | $506 | $43,640 | $43,640 | $0 |
| 2018 | $567 | $43,640 | $43,640 | $0 |
| 2017 | $541 | $39,680 | $39,680 | $0 |
| 2016 | -- | $39,680 | $0 | $0 |
| 2015 | -- | $34,120 | $0 | $0 |
| 2014 | -- | $34,120 | $0 | $0 |
Source: Public Records
Map
Nearby Homes
- 57 E 200 N
- 374 E 410 N
- 2033 S Sleepy Sage Ln
- 195 E 650 N Unit 5
- 185 E 650 N Unit 4
- 160 E 650 N Unit 3
- 155 E 650 N Unit 1
- 165 E 650 N Unit 2
- 2794 S 325 W
- 2749 Mulberry Ln Unit 4
- 0 E Landslide Rd Unit 1
- 80 N 200 W
- 391 W 2300 S
- 471 W 2300 S
- 501 W 2300 S
- 155 W 1500 S
- 690 1100 S
- 949 W Torrey Pines Dr
- 1157 E 2350 N Unit 1
- 902 W Southern Hills Vista