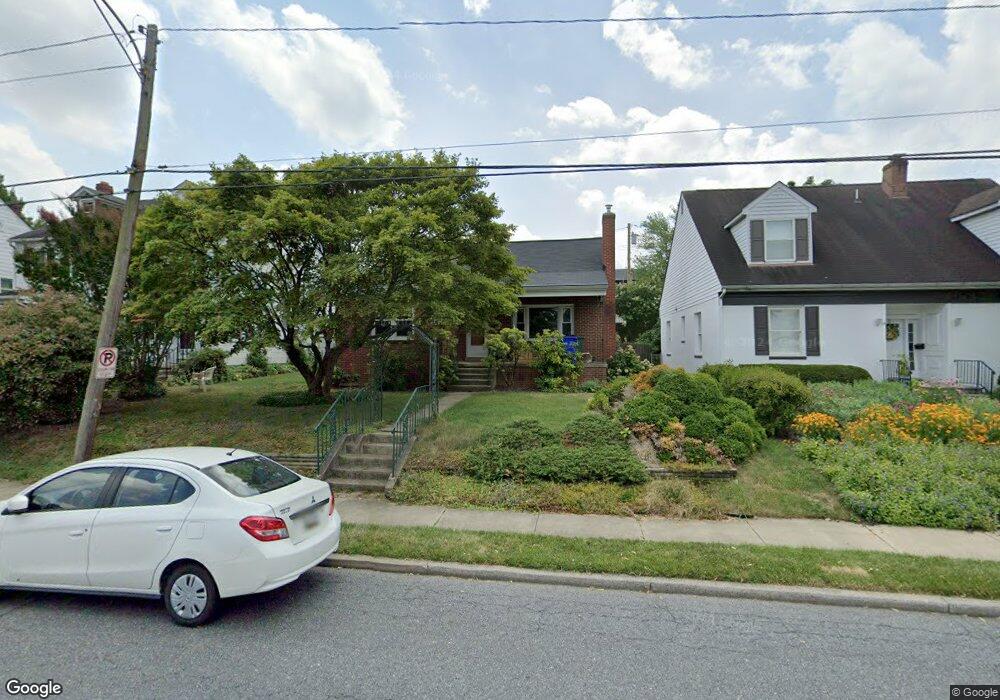
16 E 9th St Frederick, MD 21701
Selwyn Farms NeighborhoodEstimated Value: $321,033 - $376,000
Studio
1
Bath
968
Sq Ft
$360/Sq Ft
Est. Value
About This Home
This home is located at 16 E 9th St, Frederick, MD 21701 and is currently estimated at $348,758, approximately $360 per square foot. 16 E 9th St is a home located in Frederick County with nearby schools including North Frederick Elementary School, Gov. Thomas Johnson Middle School, and Gov. Thomas Johnson High School.
Ownership History
Date
Name
Owned For
Owner Type
Purchase Details
Closed on
Mar 6, 2003
Sold by
Glickman Robin
Bought by
Boyd Tracy L
Current Estimated Value
Purchase Details
Closed on
Apr 23, 1991
Sold by
Cramer Kirk Donald
Bought by
Glickman Robin
Home Financials for this Owner
Home Financials are based on the most recent Mortgage that was taken out on this home.
Original Mortgage
$48,786
Interest Rate
9.47%
Create a Home Valuation Report for This Property
The Home Valuation Report is an in-depth analysis detailing your home's value as well as a comparison with similar homes in the area
Home Values in the Area
Average Home Value in this Area
Purchase History
| Date | Buyer | Sale Price | Title Company |
|---|---|---|---|
| Boyd Tracy L | $170,000 | -- | |
| Glickman Robin | $107,000 | -- |
Source: Public Records
Mortgage History
| Date | Status | Borrower | Loan Amount |
|---|---|---|---|
| Previous Owner | Glickman Robin | $48,786 |
Source: Public Records
Tax History
| Year | Tax Paid | Tax Assessment Tax Assessment Total Assessment is a certain percentage of the fair market value that is determined by local assessors to be the total taxable value of land and additions on the property. | Land | Improvement |
|---|---|---|---|---|
| 2025 | $4,390 | $258,800 | $104,400 | $154,400 |
| 2024 | $4,390 | $243,333 | $0 | $0 |
| 2023 | $4,065 | $227,867 | $0 | $0 |
| 2022 | $3,857 | $212,400 | $91,600 | $120,800 |
| 2021 | $3,580 | $204,900 | $0 | $0 |
| 2020 | $3,580 | $197,400 | $0 | $0 |
| 2019 | $3,445 | $189,900 | $85,600 | $104,300 |
| 2018 | $3,453 | $188,667 | $0 | $0 |
| 2017 | $3,397 | $189,900 | $0 | $0 |
| 2016 | $3,147 | $186,200 | $0 | $0 |
| 2015 | $3,147 | $180,900 | $0 | $0 |
| 2014 | $3,147 | $175,600 | $0 | $0 |
Source: Public Records
Map
Nearby Homes
Your Personal Tour Guide
Ask me questions while you tour the home.