Estimated Value: $1,119,000 - $1,488,000
4
Beds
3
Baths
3,482
Sq Ft
$377/Sq Ft
Est. Value
About This Home
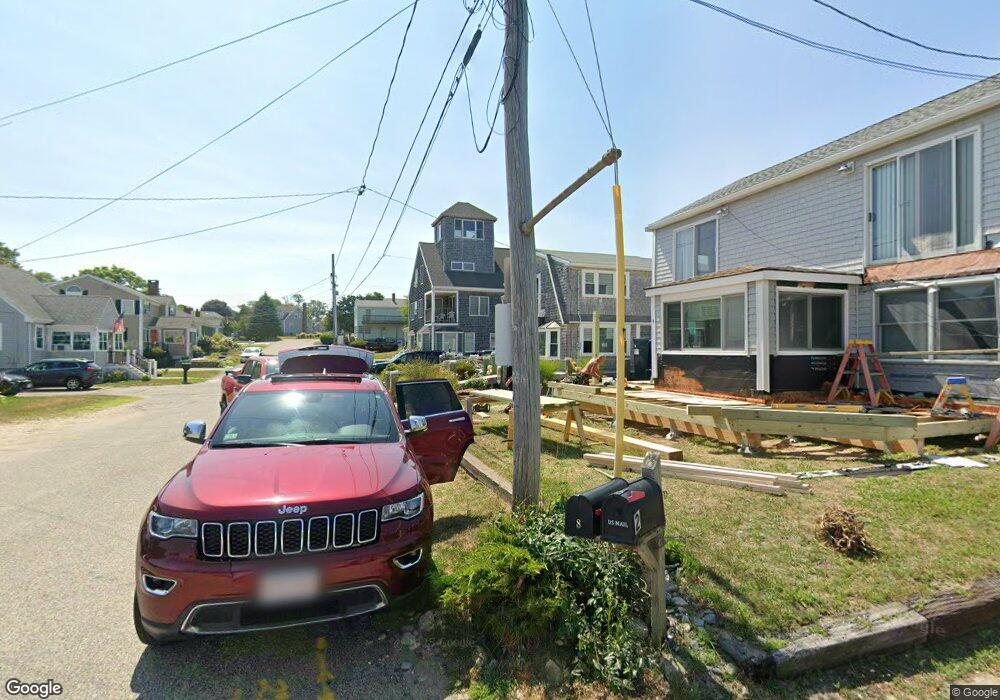
This home is located at 16 East St, Marshfield, MA 02050 and is currently estimated at $1,312,175, approximately $376 per square foot. 16 East St is a home located in Plymouth County with nearby schools including Daniel Webster, Furnace Brook Middle School, and Marshfield High School.
Ownership History
Date
Name
Owned For
Owner Type
Purchase Details
Closed on
Feb 15, 2024
Sold by
Hanna John S and Hanna Roseann
Bought by
Jrh Realty Holdings Llc
Current Estimated Value
Purchase Details
Closed on
Nov 14, 2003
Sold by
Goldsmith Nancy E and Morgan James S
Bought by
Hanna John S and Hanna Roseann
Purchase Details
Closed on
Dec 7, 1998
Sold by
Mele Anthony F and Mele Marguerite K
Bought by
Goldsmith Nancy E and Morgan James S
Purchase Details
Closed on
Apr 8, 1987
Sold by
Juliani Mary
Bought by
Mele Anthony F
Create a Home Valuation Report for This Property
The Home Valuation Report is an in-depth analysis detailing your home's value as well as a comparison with similar homes in the area
Home Values in the Area
Average Home Value in this Area
Purchase History
| Date | Buyer | Sale Price | Title Company |
|---|---|---|---|
| Jrh Realty Holdings Llc | -- | None Available | |
| Hanna John S | $693,700 | -- | |
| Hanna John S | $693,700 | -- | |
| Goldsmith Nancy E | $180,000 | -- | |
| Mele Anthony F | $36,000 | -- |
Source: Public Records
Tax History Compared to Growth
Tax History
| Year | Tax Paid | Tax Assessment Tax Assessment Total Assessment is a certain percentage of the fair market value that is determined by local assessors to be the total taxable value of land and additions on the property. | Land | Improvement |
|---|---|---|---|---|
| 2025 | $10,927 | $1,103,700 | $500,300 | $603,400 |
| 2024 | $10,261 | $987,600 | $446,700 | $540,900 |
| 2023 | $9,975 | $875,500 | $405,000 | $470,500 |
| 2022 | $9,975 | $770,300 | $367,300 | $403,000 |
| 2021 | $9,625 | $729,700 | $367,300 | $362,400 |
| 2020 | $8,983 | $673,900 | $321,600 | $352,300 |
| 2019 | $8,745 | $653,600 | $321,600 | $332,000 |
| 2018 | $8,047 | $601,900 | $277,900 | $324,000 |
| 2017 | $7,901 | $575,900 | $277,900 | $298,000 |
| 2016 | $7,519 | $541,700 | $264,000 | $277,700 |
| 2015 | $7,109 | $534,900 | $264,000 | $270,900 |
| 2014 | $7,090 | $533,500 | $264,000 | $269,500 |
Source: Public Records
Map
Nearby Homes