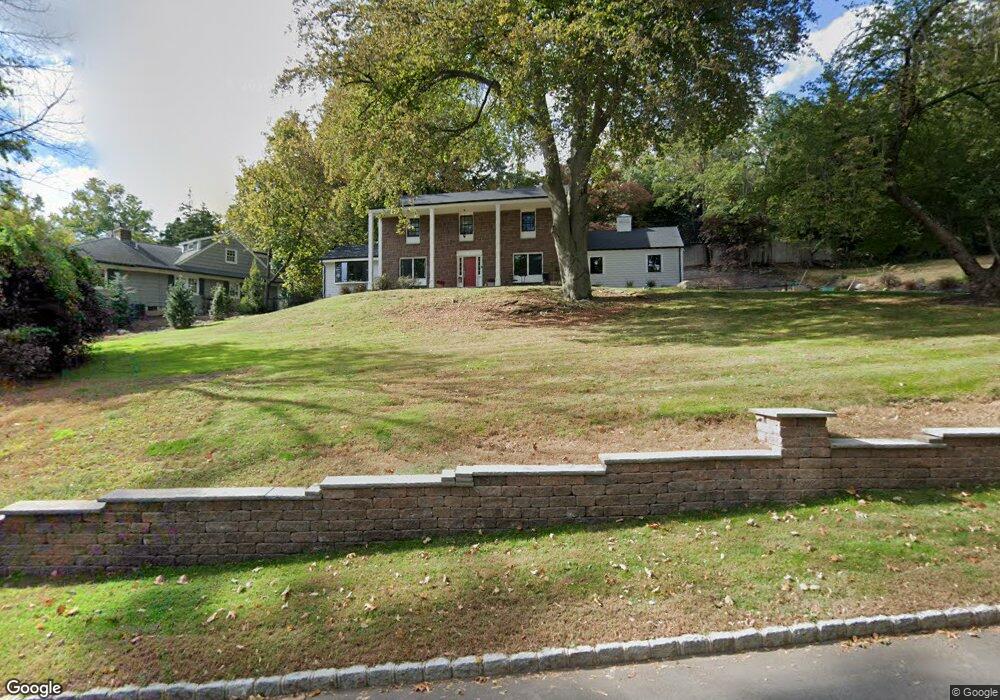
16 Edgewood Rd Montclair, NJ 07042
Estimated Value: $1,200,000 - $1,622,000
Studio
--
Bath
2,524
Sq Ft
$561/Sq Ft
Est. Value
About This Home
This home is located at 16 Edgewood Rd, Montclair, NJ 07042 and is currently estimated at $1,415,177, approximately $560 per square foot. 16 Edgewood Rd is a home located in Essex County with nearby schools including Hillside School, Bradford School, and Nishuane School.
Ownership History
Date
Name
Owned For
Owner Type
Purchase Details
Closed on
Mar 4, 2020
Sold by
Gorman Terence J and Gorman Margaret Cafferty
Bought by
Conway Curtis and Pipkins Donyale
Current Estimated Value
Home Financials for this Owner
Home Financials are based on the most recent Mortgage that was taken out on this home.
Original Mortgage
$645,000
Outstanding Balance
$571,240
Interest Rate
3.5%
Mortgage Type
New Conventional
Estimated Equity
$843,937
Purchase Details
Closed on
Apr 3, 2003
Sold by
Weiner Fred
Bought by
Gorman Terence and Gorman Margaret
Purchase Details
Closed on
Jun 24, 1999
Sold by
Boyle Barbara
Bought by
Gorman Terrence and Gorman Margaret
Home Financials for this Owner
Home Financials are based on the most recent Mortgage that was taken out on this home.
Original Mortgage
$377,000
Interest Rate
7.65%
Create a Home Valuation Report for This Property
The Home Valuation Report is an in-depth analysis detailing your home's value as well as a comparison with similar homes in the area
Home Values in the Area
Average Home Value in this Area
Purchase History
| Date | Buyer | Sale Price | Title Company |
|---|---|---|---|
| Conway Curtis | $740,000 | Vital Abstract Llc | |
| Gorman Terence | $40,000 | -- | |
| Gorman Terrence | $419,000 | -- |
Source: Public Records
Mortgage History
| Date | Status | Borrower | Loan Amount |
|---|---|---|---|
| Open | Conway Curtis | $645,000 | |
| Previous Owner | Gorman Terrence | $377,000 |
Source: Public Records
Tax History
| Year | Tax Paid | Tax Assessment Tax Assessment Total Assessment is a certain percentage of the fair market value that is determined by local assessors to be the total taxable value of land and additions on the property. | Land | Improvement |
|---|---|---|---|---|
| 2025 | $24,728 | $731,600 | $518,800 | $212,800 |
| 2024 | $24,728 | $731,600 | $518,800 | $212,800 |
| 2022 | $24,055 | $731,600 | $518,800 | $212,800 |
| 2021 | $23,638 | $731,600 | $518,800 | $212,800 |
| 2020 | $25,804 | $811,700 | $518,800 | $292,900 |
| 2019 | $25,244 | $802,400 | $509,500 | $292,900 |
| 2018 | $24,826 | $802,400 | $509,500 | $292,900 |
| 2017 | $25,354 | $679,000 | $352,600 | $326,400 |
| 2016 | $24,675 | $679,000 | $352,600 | $326,400 |
| 2015 | $23,942 | $679,000 | $352,600 | $326,400 |
| 2014 | $23,140 | $679,000 | $352,600 | $326,400 |
Source: Public Records
Map
Nearby Homes
- 1 Claridge Dr Unit 503
- 1 Claridge Dr Unit 723
- 2 Claridge Dr Unit 1FW
- 2 Claridge Dr Unit 7NE
- 2 Claridge Dr
- 2 Claridge Dr Unit 8IE
- 2 Claridge Dr Unit 4MW
- 2 Claridge Dr Unit 1NE
- 2 Claridge Dr Unit 8AE
- 2 Claridge Dr 3lw
- 2 Claridge Dr 4fw
- 2 Claridge Dr 8lw
- 12 Kips Ridge Unit 12
- 215 Upper Mountain Ave
- 10 Crestmont Rd Unit 6C
- 24 Club Way
- 23 Mount Vernon Square
- 142 Pompton Ave
- 415 Claremont Ave Unit 4A
- 29 Upper Mountain Ave Unit C2901
- 1 Edgewood Terrace
- 19 Edgewood Rd
- 10 Edgewood Terrace
- 21 Edgewood Rd
- 2 Edgewood Terrace
- 117 Highland Ave
- 136 Upper Mountain Ave
- 93 Prospect Ave
- 140 Upper Mountain Ave
- 29 Edgewood Rd
- 122 Upper Mountain Ave
- 96 Prospect Ave
- 89 Highland Ave
- 150 Upper Mountain Ave
- 87 Prospect Ave
- 35 Edgewood Rd
- 106 Highland Ave
- 100 Highland Ave
- 114 Upper Mountain Ave
- 120 Highland Ave
Your Personal Tour Guide
Ask me questions while you tour the home.