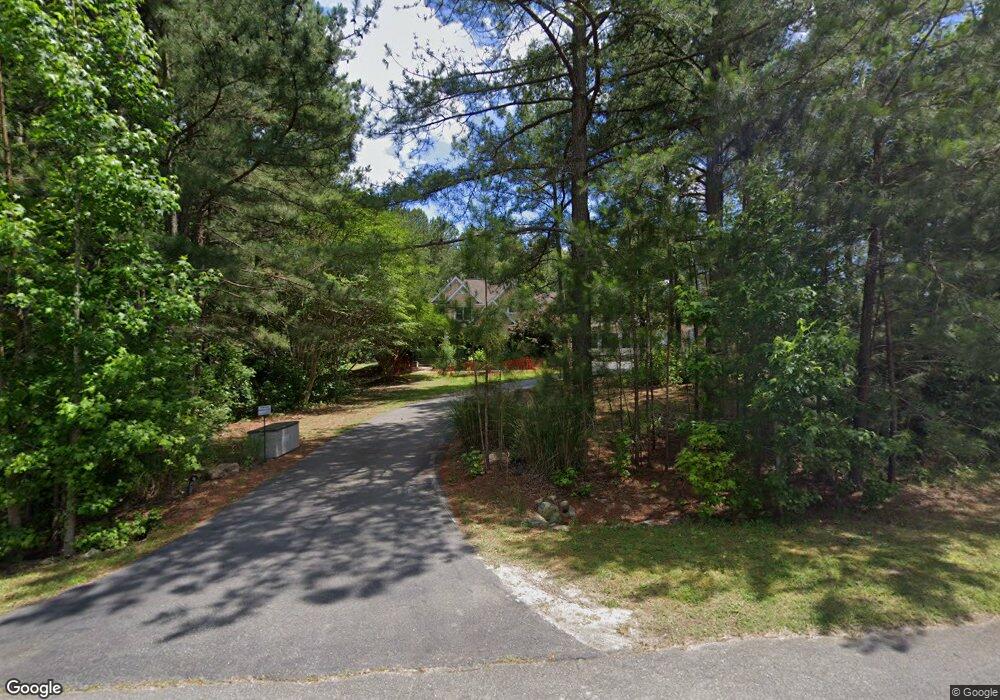
16 Emerald Crest Ct Chapel Hill, NC 27516
Estimated Value: $843,000 - $1,325,960
3
Beds
3
Baths
3,255
Sq Ft
$341/Sq Ft
Est. Value
About This Home
This home is located at 16 Emerald Crest Ct, Chapel Hill, NC 27516 and is currently estimated at $1,110,490, approximately $341 per square foot. 16 Emerald Crest Ct is a home located in Chatham County with nearby schools including Margaret B. Pollard Middle School, Northwood High, and Woods Charter.
Ownership History
Date
Name
Owned For
Owner Type
Purchase Details
Closed on
Sep 8, 2020
Sold by
Odowd Doreen Ann and Odowd John Patrick
Bought by
Lopez Couto Evelyn and Lopez Couto Rene
Current Estimated Value
Home Financials for this Owner
Home Financials are based on the most recent Mortgage that was taken out on this home.
Original Mortgage
$345,000
Outstanding Balance
$304,892
Interest Rate
2.8%
Mortgage Type
New Conventional
Estimated Equity
$805,598
Purchase Details
Closed on
Sep 13, 2012
Sold by
Brookfield Relocation Inc
Bought by
Odowd Doreen Ann and Odowd John Patrick
Purchase Details
Closed on
Sep 11, 2011
Sold by
Ratelband Martin and Ratelband Karen
Bought by
Prudential Relocation Inc
Purchase Details
Closed on
Dec 9, 2005
Sold by
The Cottages At Stonegate Llc
Bought by
Ratelband Martin and Ratelband Karen
Create a Home Valuation Report for This Property
The Home Valuation Report is an in-depth analysis detailing your home's value as well as a comparison with similar homes in the area
Home Values in the Area
Average Home Value in this Area
Purchase History
| Date | Buyer | Sale Price | Title Company |
|---|---|---|---|
| Lopez Couto Evelyn | $5,450 | None Available | |
| Odowd Doreen Ann | $465,000 | None Available | |
| Prudential Relocation Inc | $465,000 | None Available | |
| Ratelband Martin | $108,000 | None Available |
Source: Public Records
Mortgage History
| Date | Status | Borrower | Loan Amount |
|---|---|---|---|
| Open | Lopez Couto Evelyn | $345,000 |
Source: Public Records
Tax History Compared to Growth
Tax History
| Year | Tax Paid | Tax Assessment Tax Assessment Total Assessment is a certain percentage of the fair market value that is determined by local assessors to be the total taxable value of land and additions on the property. | Land | Improvement |
|---|---|---|---|---|
| 2025 | $7,988 | $1,093,182 | $166,350 | $926,832 |
| 2024 | $7,988 | $765,440 | $153,934 | $611,506 |
| 2023 | $6,803 | $610,340 | $153,934 | $456,406 |
| 2022 | $4,904 | $610,340 | $153,934 | $456,406 |
| 2021 | $4,843 | $610,340 | $153,934 | $456,406 |
| 2020 | $3,983 | $544,860 | $124,397 | $420,463 |
| 2019 | $4,364 | $544,860 | $124,397 | $420,463 |
| 2018 | $0 | $544,860 | $124,397 | $420,463 |
| 2017 | $4,074 | $544,860 | $124,397 | $420,463 |
| 2016 | $3,922 | $519,890 | $124,397 | $395,493 |
| 2015 | -- | $519,890 | $124,397 | $395,493 |
| 2014 | -- | $519,890 | $124,397 | $395,493 |
| 2013 | -- | $519,890 | $124,397 | $395,493 |
Source: Public Records
Map
Nearby Homes
- 34 Chestnut Way
- 51 Araya Ln
- 110 Wolfs Trail
- 103 Stonehill Rd
- 23 Bonterra Way
- 170 Kenwood Ln
- 33 Henry Ct
- 93 Kenwood Ln
- 82 Margaret Daniel Ln
- 75 Kenwood Ln
- L2-37 Lamont Norwood Rd
- 3502 Stonegate Dr
- 337 Ivy Ridge Rd
- 269 Ivy Ridge Rd
- 318 Ivy Ridge Rd
- 250 Ivy Ridge Rd
- 560 Great Ridge Pkwy
- 586 Great Ridge Pkwy
- 556 Great Ridge Pkwy
- 91 Ivy Ridge Rd
- 16 Emerald Crest Point
- 41 Emerald Crest Point
- 41 Emerald Crest Point Unit Lt 13
- 26 Cannamann Rd
- 26 Cannamann Rd Unit 9
- 80 Emerald Crest Point
- 80 Emerald Crest Ct
- 65 Cannamann Rd
- 128 Gilmore Rd
- 128 Gilmore Rd Unit 8
- 47 Cannamann Rd
- 47 Cannamann Rd Unit 20
- 18 White Pine Way
- 24 Bell Flower Ct
- 24 Bell Flower Ct Unit 24
- 107 Cannamann Rd Unit 18
- 107 Cannamann Rd
- 83 Emerald Crest Point
- 83 Emerald Crest Point Unit 12
- 90 Gilmore Rd