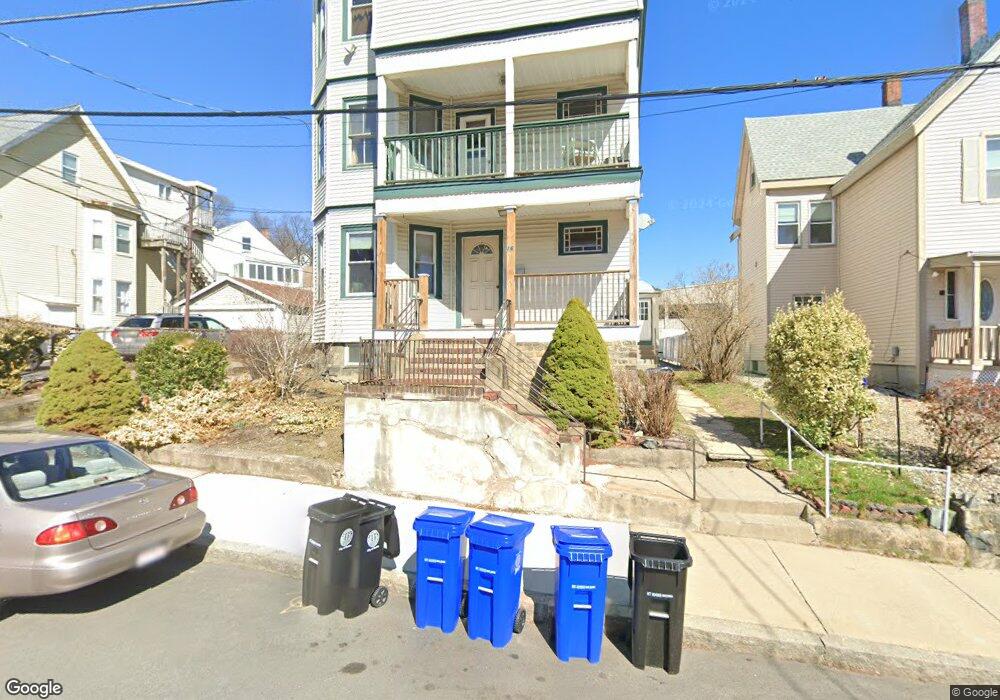
16 Faulkner St Unit 3 Malden, MA 02148
North Faulkner NeighborhoodEstimated Value: $1,406,489 - $1,426,000
3
Beds
1
Bath
1,250
Sq Ft
$1,133/Sq Ft
Est. Value
About This Home
This home is located at 16 Faulkner St Unit 3, Malden, MA 02148 and is currently estimated at $1,416,372, approximately $1,133 per square foot. 16 Faulkner St Unit 3 is a home located in Middlesex County with nearby schools including Malden High School, Cheverus Catholic School, and Malden Catholic.
Ownership History
Date
Name
Owned For
Owner Type
Purchase Details
Closed on
Jul 19, 2012
Sold by
Smith Michael S and Smith Geraldine T
Bought by
Tse Yuanyuan and Tse Kwoc C
Current Estimated Value
Home Financials for this Owner
Home Financials are based on the most recent Mortgage that was taken out on this home.
Original Mortgage
$408,750
Outstanding Balance
$282,555
Interest Rate
3.7%
Mortgage Type
New Conventional
Estimated Equity
$1,133,817
Purchase Details
Closed on
Apr 15, 2005
Sold by
Smith Michael
Bought by
Smith Geraldine and Smith Michael
Create a Home Valuation Report for This Property
The Home Valuation Report is an in-depth analysis detailing your home's value as well as a comparison with similar homes in the area
Home Values in the Area
Average Home Value in this Area
Purchase History
| Date | Buyer | Sale Price | Title Company |
|---|---|---|---|
| Tse Yuanyuan | $545,000 | -- | |
| Smith Geraldine | -- | -- | |
| Smith Geraldine | -- | -- |
Source: Public Records
Mortgage History
| Date | Status | Borrower | Loan Amount |
|---|---|---|---|
| Open | Tse Yuanyuan | $408,750 | |
| Closed | Smith Geraldine | $408,750 | |
| Previous Owner | Smith Geraldine | $163,000 |
Source: Public Records
Tax History Compared to Growth
Tax History
| Year | Tax Paid | Tax Assessment Tax Assessment Total Assessment is a certain percentage of the fair market value that is determined by local assessors to be the total taxable value of land and additions on the property. | Land | Improvement |
|---|---|---|---|---|
| 2025 | $153 | $1,355,700 | $329,100 | $1,026,600 |
| 2024 | $14,589 | $1,248,000 | $310,800 | $937,200 |
| 2023 | $14,699 | $1,205,800 | $283,400 | $922,400 |
| 2022 | $11,356 | $919,500 | $256,000 | $663,500 |
| 2021 | $10,750 | $874,700 | $228,500 | $646,200 |
| 2020 | $10,750 | $849,800 | $220,800 | $629,000 |
| 2019 | $10,207 | $769,200 | $210,200 | $559,000 |
| 2018 | $9,508 | $674,800 | $173,700 | $501,100 |
| 2017 | $8,644 | $610,000 | $166,800 | $443,200 |
| 2016 | $10,738 | $708,300 | $153,100 | $555,200 |
| 2015 | $10,179 | $647,100 | $145,800 | $501,300 |
| 2014 | $9,575 | $594,700 | $132,500 | $462,200 |
Source: Public Records
Map
Nearby Homes
- 3 Nira St
- 12 Norwood St
- 0 Brookdale
- 452 Salem St
- 30 Franklin St Unit 105
- 58 Almont St Unit 3
- 32 Johnson St
- 494 Salem St
- 19-21 Wolcott St
- 11 Granville Place
- 31 Wolcott St
- 58 Clark St
- 62 Wolcott St
- 156 Bainbridge St
- 23-25 Richardson St
- 30-32 Starbird St
- 117 Pierce St
- 11 Starbird St
- 56 Rocky Nook Unit 56
- 94 Mount Vernon St Unit 94
- 16 Faulkner St
- 16 Faulkner St Unit 1
- 20 Faulkner St
- 8 Faulkner St Unit 10
- 22 Faulkner St
- 22 Faulkner St Unit 2
- 22 Faulkner St
- 22 Faulkner St Unit 1
- 17 Faulkner St
- 15 Faulkner St
- 19 Faulkner St Unit 1
- 19 Faulkner St Unit 2
- 26 Faulkner St Unit 2
- 26 Faulkner St Unit 1
- 26 Faulkner St Unit 2 26
- 327 Salem St Unit 329
- 327 Salem St Unit 1
- 333 Salem St
- 38 Faulkner St
- 28 Faulkner St