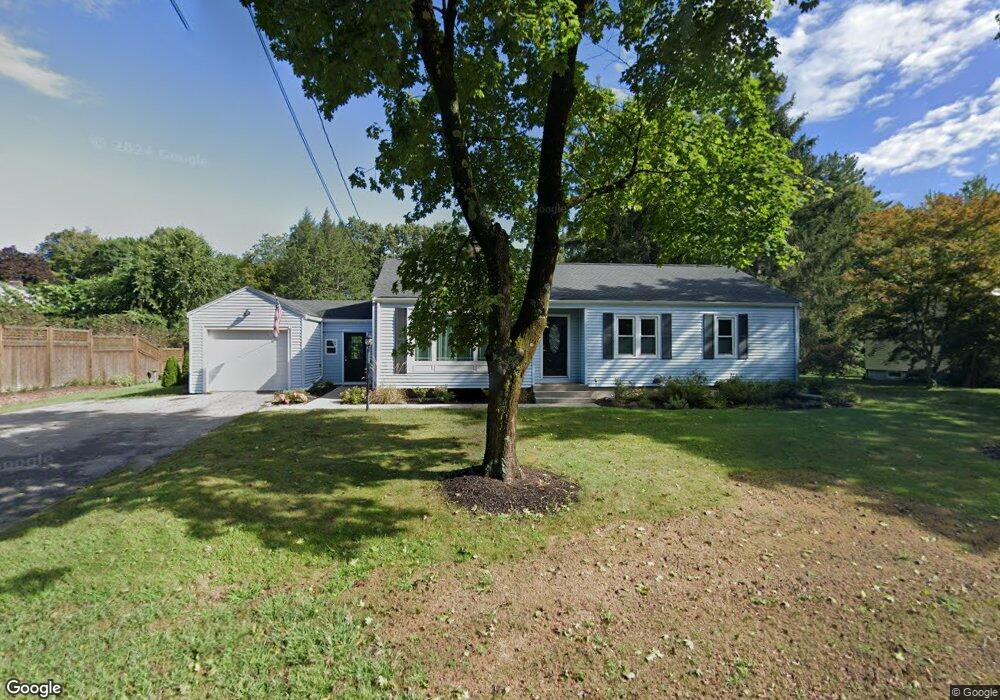
16 Flanders Rd Westborough, MA 01581
Estimated Value: $624,000 - $661,000
4
Beds
2
Baths
1,792
Sq Ft
$356/Sq Ft
Est. Value
About This Home
This home is located at 16 Flanders Rd, Westborough, MA 01581 and is currently estimated at $638,603, approximately $356 per square foot. 16 Flanders Rd is a home located in Worcester County with nearby schools including Westborough High School, Westboro Knowledge Beginnings, and Ebridge Montessori School.
Ownership History
Date
Name
Owned For
Owner Type
Purchase Details
Closed on
Jun 28, 2017
Sold by
Joseph-Thomas Jiby and Thomas Aley J
Bought by
Johnson Michael E and Johnson Anne N
Current Estimated Value
Home Financials for this Owner
Home Financials are based on the most recent Mortgage that was taken out on this home.
Original Mortgage
$292,000
Outstanding Balance
$243,465
Interest Rate
4.02%
Mortgage Type
New Conventional
Estimated Equity
$395,138
Purchase Details
Closed on
Sep 27, 2007
Sold by
Kalagher-Davies Gail L and Kalagher Harold Bernard
Bought by
Thomas Aley J and Joseph-Thomas Jiby
Home Financials for this Owner
Home Financials are based on the most recent Mortgage that was taken out on this home.
Original Mortgage
$248,000
Interest Rate
6.65%
Mortgage Type
Purchase Money Mortgage
Create a Home Valuation Report for This Property
The Home Valuation Report is an in-depth analysis detailing your home's value as well as a comparison with similar homes in the area
Home Values in the Area
Average Home Value in this Area
Purchase History
| Date | Buyer | Sale Price | Title Company |
|---|---|---|---|
| Johnson Michael E | $365,000 | -- | |
| Thomas Aley J | $310,000 | -- |
Source: Public Records
Mortgage History
| Date | Status | Borrower | Loan Amount |
|---|---|---|---|
| Open | Johnson Michael E | $292,000 | |
| Previous Owner | Thomas Aley J | $248,000 |
Source: Public Records
Tax History Compared to Growth
Tax History
| Year | Tax Paid | Tax Assessment Tax Assessment Total Assessment is a certain percentage of the fair market value that is determined by local assessors to be the total taxable value of land and additions on the property. | Land | Improvement |
|---|---|---|---|---|
| 2025 | $8,367 | $513,600 | $322,400 | $191,200 |
| 2024 | $8,197 | $499,500 | $299,900 | $199,600 |
| 2023 | $7,765 | $461,100 | $284,200 | $176,900 |
| 2022 | $7,052 | $381,400 | $225,900 | $155,500 |
| 2021 | $3,553 | $356,800 | $201,300 | $155,500 |
| 2020 | $6,780 | $370,100 | $209,500 | $160,600 |
| 2019 | $3,293 | $345,800 | $209,500 | $136,300 |
| 2018 | $3,343 | $305,800 | $195,100 | $110,700 |
| 2017 | $3,386 | $303,600 | $195,100 | $108,500 |
| 2016 | $5,237 | $294,700 | $184,800 | $109,900 |
| 2015 | $5,426 | $291,900 | $184,800 | $107,100 |
Source: Public Records
Map
Nearby Homes
- 5 Chauncy Cir
- 23 Water St
- 14 Mayberry Dr Unit 10
- 7 Mayberry Dr Unit H
- 28 Crestview Dr
- 48 High Street Extension
- 21 South St Unit 31
- 3 Dover Way
- 15 Beach St
- 14 Grove St Unit 2
- 4403 Peters Farm Way Unit 403
- 196 -198 Turnpike Rd
- 9 Treetop Park
- 19 Treetop Park Unit 19
- 75 South St
- 43 Church St
- 22 Treetop Park
- 52 Treetop Park Unit 52
- 9 Shaker Way
- 3112 Peters Farm Way Unit 112