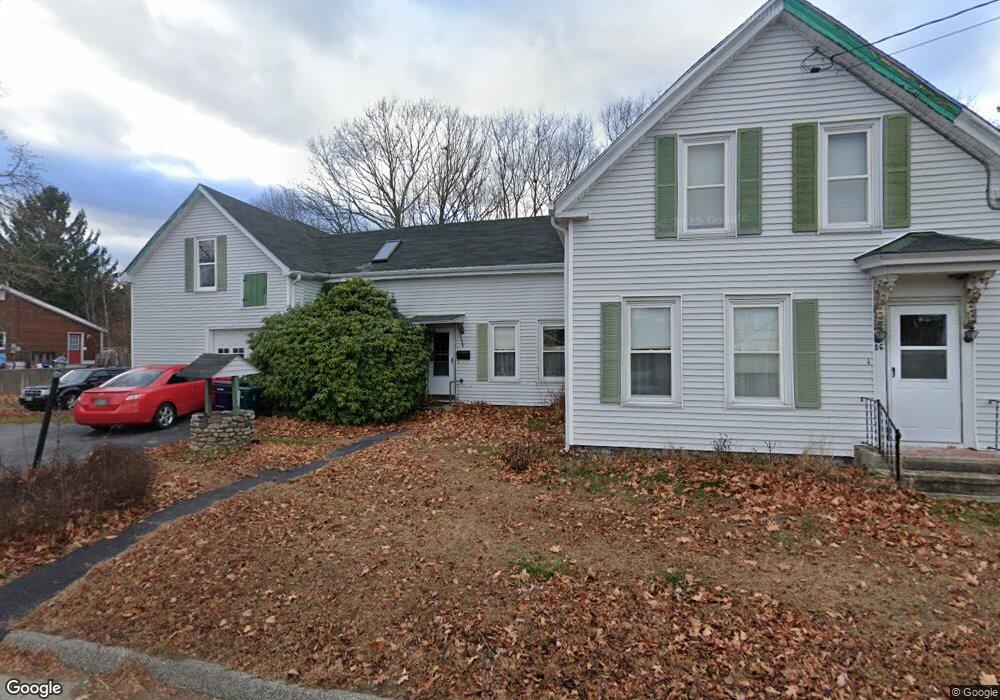
16 Forest St Biddeford, ME 04005
Estimated Value: $389,212 - $422,000
3
Beds
--
Bath
1,499
Sq Ft
$273/Sq Ft
Est. Value
About This Home
This home is located at 16 Forest St, Biddeford, ME 04005 and is currently estimated at $409,053, approximately $272 per square foot. 16 Forest St is a home located in York County with nearby schools including John F Kennedy Memorial School, Biddeford Primary School, and Biddeford Intermediate School.
Ownership History
Date
Name
Owned For
Owner Type
Purchase Details
Closed on
Aug 9, 2005
Sold by
Conner Paul F
Bought by
Conner Kimberly A
Current Estimated Value
Home Financials for this Owner
Home Financials are based on the most recent Mortgage that was taken out on this home.
Original Mortgage
$120,000
Interest Rate
5.63%
Mortgage Type
Purchase Money Mortgage
Create a Home Valuation Report for This Property
The Home Valuation Report is an in-depth analysis detailing your home's value as well as a comparison with similar homes in the area
Home Values in the Area
Average Home Value in this Area
Purchase History
| Date | Buyer | Sale Price | Title Company |
|---|---|---|---|
| Conner Kimberly A | -- | -- |
Source: Public Records
Mortgage History
| Date | Status | Borrower | Loan Amount |
|---|---|---|---|
| Closed | Conner Kimberly A | $120,000 |
Source: Public Records
Tax History
| Year | Tax Paid | Tax Assessment Tax Assessment Total Assessment is a certain percentage of the fair market value that is determined by local assessors to be the total taxable value of land and additions on the property. | Land | Improvement |
|---|---|---|---|---|
| 2025 | $4,367 | $292,300 | $168,400 | $123,900 |
| 2024 | $4,127 | $290,200 | $168,400 | $121,800 |
| 2023 | $3,767 | $287,100 | $165,300 | $121,800 |
| 2022 | $3,719 | $226,600 | $93,200 | $133,400 |
| 2021 | $3,081 | $194,000 | $78,800 | $115,200 |
| 2020 | $3,595 | $179,300 | $71,700 | $107,600 |
| 2019 | $621 | $179,300 | $71,700 | $107,600 |
| 2018 | $3,532 | $179,300 | $71,700 | $107,600 |
| 2017 | $634 | $171,800 | $71,700 | $100,100 |
| 2016 | $3,412 | $171,800 | $71,700 | $100,100 |
| 2015 | $3,150 | $171,800 | $71,700 | $100,100 |
| 2014 | $3,073 | $171,800 | $71,700 | $100,100 |
| 2013 | -- | $171,200 | $63,400 | $107,800 |
Source: Public Records
Map
Nearby Homes
Your Personal Tour Guide
Ask me questions while you tour the home.