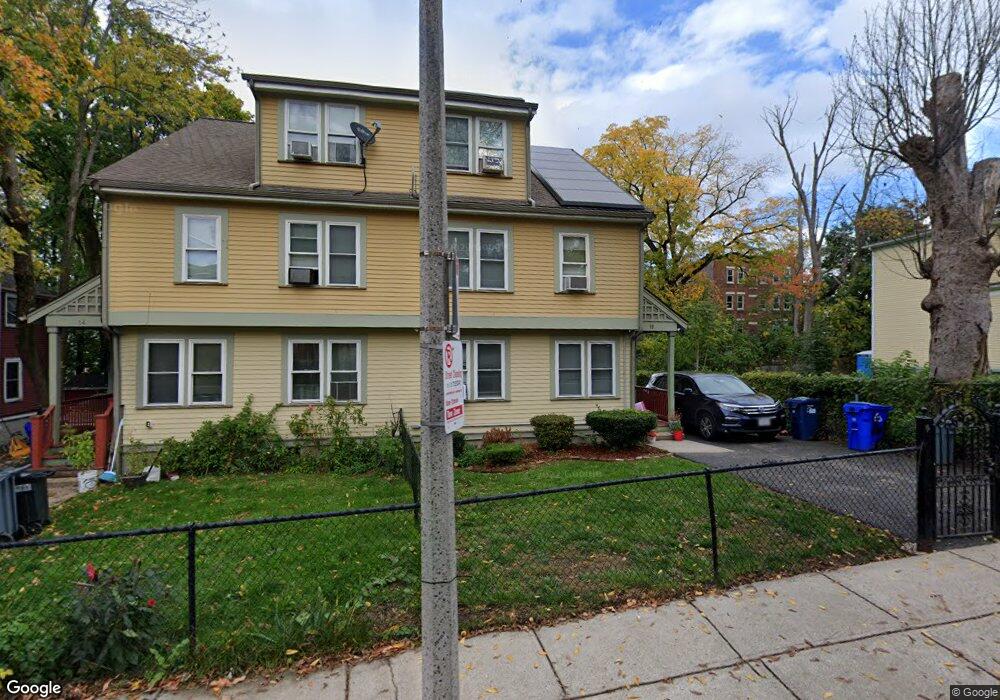
16 Forest St Roxbury, MA 02119
Sav-Mor NeighborhoodEstimated Value: $347,000 - $532,793
3
Beds
2
Baths
1,782
Sq Ft
$260/Sq Ft
Est. Value
About This Home
This home is located at 16 Forest St, Roxbury, MA 02119 and is currently estimated at $462,948, approximately $259 per square foot. 16 Forest St is a home located in Suffolk County with nearby schools including Dudley Street Neighborhood Charter School and City on a Hill Charter Public School.
Ownership History
Date
Name
Owned For
Owner Type
Purchase Details
Closed on
Oct 20, 2004
Sold by
Roxbury Dev Corp
Bought by
Martin Maria and Smith Phillip
Current Estimated Value
Home Financials for this Owner
Home Financials are based on the most recent Mortgage that was taken out on this home.
Original Mortgage
$147,250
Outstanding Balance
$73,316
Interest Rate
5.85%
Mortgage Type
Purchase Money Mortgage
Estimated Equity
$389,632
Create a Home Valuation Report for This Property
The Home Valuation Report is an in-depth analysis detailing your home's value as well as a comparison with similar homes in the area
Home Values in the Area
Average Home Value in this Area
Purchase History
| Date | Buyer | Sale Price | Title Company |
|---|---|---|---|
| Martin Maria | $155,000 | -- | |
| Martin Maria | $155,000 | -- |
Source: Public Records
Mortgage History
| Date | Status | Borrower | Loan Amount |
|---|---|---|---|
| Open | Martin Maria | $147,250 | |
| Closed | Martin Maria | $6,200 | |
| Closed | Martin Maria | $147,250 |
Source: Public Records
Tax History
| Year | Tax Paid | Tax Assessment Tax Assessment Total Assessment is a certain percentage of the fair market value that is determined by local assessors to be the total taxable value of land and additions on the property. | Land | Improvement |
|---|---|---|---|---|
| 2025 | $4,532 | $391,400 | $129,162 | $262,238 |
| 2024 | $4,064 | $372,800 | $100,656 | $272,144 |
| 2023 | $3,813 | $355,000 | $95,850 | $259,150 |
| 2022 | $3,679 | $338,100 | $91,287 | $246,813 |
| 2021 | $3,436 | $322,000 | $0 | $322,000 |
| 2020 | $3,239 | $306,700 | $0 | $306,700 |
| 2019 | $3,079 | $292,100 | $95,700 | $196,400 |
| 2018 | $2,916 | $278,200 | $95,700 | $182,500 |
| 2017 | $2,806 | $265,000 | $95,700 | $169,300 |
| 2016 | $2,776 | $252,400 | $95,700 | $156,700 |
| 2015 | $2,911 | $240,400 | $81,100 | $159,300 |
| 2014 | $2,881 | $229,000 | $81,100 | $147,900 |
Source: Public Records
Map
Nearby Homes
- 12 Forest St
- 10 Forest St
- 91 Zeigler St
- 102 Mount Pleasant Ave
- 20 Rockville Park
- 22 Rockville Park
- 22-22A Montrose St
- 10 Williams St Unit 23
- 33 Copeland Park Unit CC
- 2149 Washington St Unit 610
- 2149 Washington St Unit 604
- 59 Copeland St
- 24 Clarence St Unit 24R
- 51 Saint James St
- 64 Alpine St Unit 104
- 64 Alpine St Unit 304
- 30 Copeland St Unit 1
- 80 Blue Hill Ave Unit 5
- 84 Blue Hill Ave Unit 86
- 59 Perrin St Unit 3
- 14 Forest St
- 22 Forest St
- 3 Mount Pleasant Place
- 3 Mt Pleasant Place
- 11 Forest St Unit 11A
- 11 Forest St Unit 2
- 11 Forest St Unit 1
- 2 Mount Pleasant Place
- 2 Mount Pleasant Place
- 2 Mount Pleasant Place Unit 2
- 2 Mount Pleasant Place Unit 1
- 15 Forest St
- 1 Mount Pleasant Place
- 1 Mount Pleasant Place Unit 1
- 1 Mount Pleasant Place Unit 2
- 6 Forest St Unit 3
- 6 Forest St Unit 2
- 6 Forest St Unit 1
- 68 Forest St
- 291 Dudley St
Your Personal Tour Guide
Ask me questions while you tour the home.