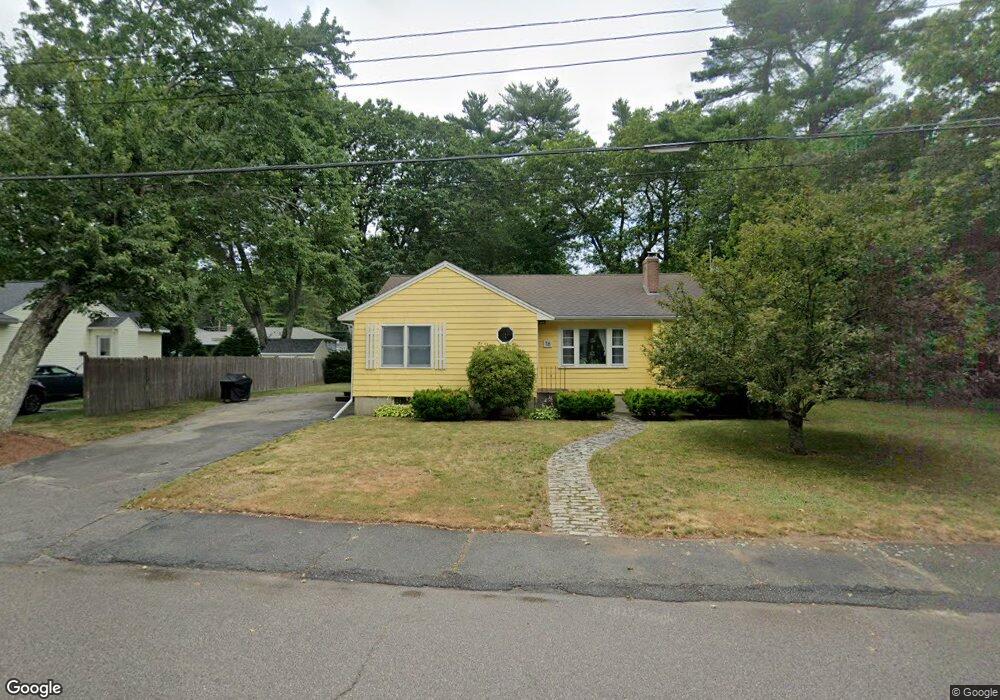
16 Francis Rd Sharon, MA 02067
Estimated Value: $667,484 - $721,000
3
Beds
2
Baths
1,506
Sq Ft
$460/Sq Ft
Est. Value
About This Home
This home is located at 16 Francis Rd, Sharon, MA 02067 and is currently estimated at $692,121, approximately $459 per square foot. 16 Francis Rd is a home located in Norfolk County with nearby schools including Heights Elementary School, Sharon Middle School, and Sharon High School.
Ownership History
Date
Name
Owned For
Owner Type
Purchase Details
Closed on
May 2, 2002
Sold by
Cole Susan M
Bought by
Allen Glenn E
Current Estimated Value
Purchase Details
Closed on
Sep 28, 2001
Sold by
Cole Susan M
Bought by
Ellen Glenn E
Home Financials for this Owner
Home Financials are based on the most recent Mortgage that was taken out on this home.
Original Mortgage
$244,000
Interest Rate
6.91%
Mortgage Type
Purchase Money Mortgage
Purchase Details
Closed on
Jul 27, 1987
Sold by
Lanoue Norma E
Bought by
Cole Russell H
Home Financials for this Owner
Home Financials are based on the most recent Mortgage that was taken out on this home.
Original Mortgage
$110,000
Interest Rate
10.67%
Mortgage Type
Purchase Money Mortgage
Create a Home Valuation Report for This Property
The Home Valuation Report is an in-depth analysis detailing your home's value as well as a comparison with similar homes in the area
Home Values in the Area
Average Home Value in this Area
Purchase History
| Date | Buyer | Sale Price | Title Company |
|---|---|---|---|
| Allen Glenn E | $305,000 | -- | |
| Ellen Glenn E | $305,000 | -- | |
| Cole Russell H | $161,500 | -- |
Source: Public Records
Mortgage History
| Date | Status | Borrower | Loan Amount |
|---|---|---|---|
| Open | Cole Russell H | $260,000 | |
| Closed | Cole Russell H | $268,000 | |
| Previous Owner | Ellen Glenn E | $244,000 | |
| Previous Owner | Cole Russell H | $100,000 | |
| Previous Owner | Cole Russell H | $110,000 |
Source: Public Records
Tax History Compared to Growth
Tax History
| Year | Tax Paid | Tax Assessment Tax Assessment Total Assessment is a certain percentage of the fair market value that is determined by local assessors to be the total taxable value of land and additions on the property. | Land | Improvement |
|---|---|---|---|---|
| 2025 | $9,364 | $535,700 | $352,100 | $183,600 |
| 2024 | $8,989 | $511,300 | $323,000 | $188,300 |
| 2023 | $8,791 | $472,900 | $301,900 | $171,000 |
| 2022 | $8,469 | $428,800 | $251,500 | $177,300 |
| 2021 | $8,374 | $409,900 | $237,300 | $172,600 |
| 2020 | $7,788 | $409,900 | $237,300 | $172,600 |
| 2019 | $7,244 | $373,200 | $210,000 | $163,200 |
| 2018 | $7,149 | $369,100 | $205,900 | $163,200 |
| 2017 | $6,977 | $355,600 | $192,400 | $163,200 |
| 2016 | $6,866 | $341,400 | $192,400 | $149,000 |
| 2015 | $6,407 | $315,600 | $176,500 | $139,100 |
| 2014 | $5,933 | $288,700 | $160,500 | $128,200 |
Source: Public Records
Map
Nearby Homes
- 28 Norfolk Place
- 27 Henry St
- 111 E Foxboro St
- 148 S Main St
- 5 Trowel Pond Shop Rd Unit C
- 137 Pond St
- 150 Pond St
- 16 Forest Rd
- 54 Depot St
- 630 S Main St
- 29 Station St
- 277 Everett St
- 180 Old Post Rd Unit 202
- 180 Old Post Rd Unit 206
- 180 Old Post Rd Unit 201
- 180 Old Post Rd Unit 207
- 49 Cottage St
- 668 S Main St
- 32 Billings St Unit A
- 97 Old Post Rd