
Seller's Agent in 2025
Alison Borrelli
Berkshire Hathaway HomeServices Commonwealth Real Estate
(617) 257-3012
54 in this area
93 Total Sales
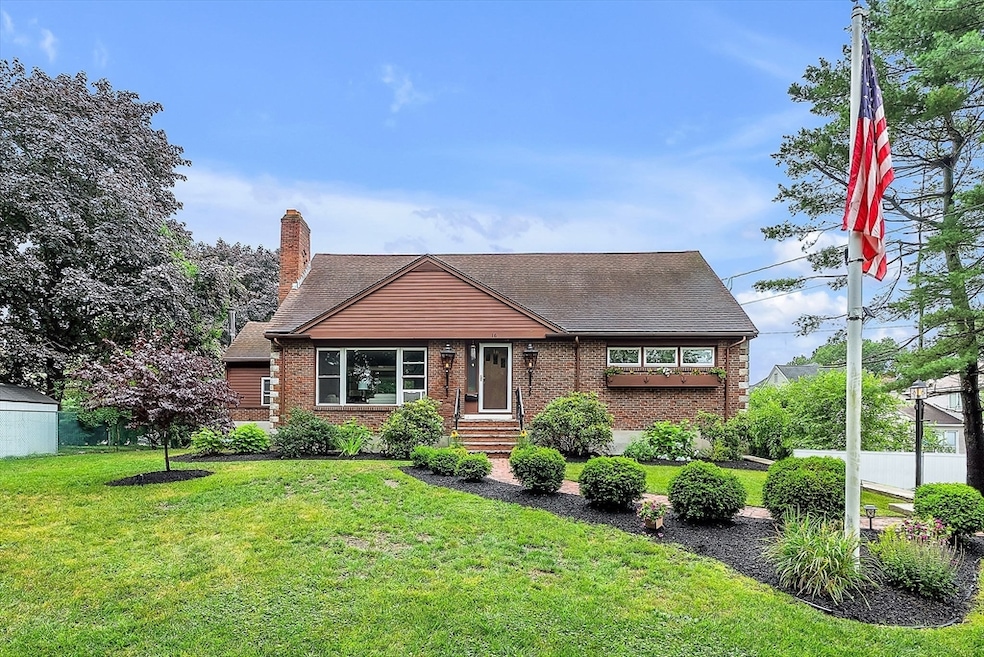


** open house canceled*** First time on the market! Custom built by a master mason and cherished by one family since 1963, this warm and welcoming 5-bedroom, 3-bathroom home in Needham Heights offers the space, layout, and location today’s buyers are looking for. With solid bones and endless potential, it’s ready for your personal touch to create a home that grows with you. The spacious main level features hardwood floors throughout, a generous living room with fireplace, a sunny 3-season room perfect for play or relaxing, and a flexible first-floor bedroom plus office or nursery with laundry access. The finished basement includes a full bath, oversized family room, and bonus room—ideal for hosting, hobbies, or play. Outside, the flat, professionally landscaped yard and oversized patio are ready for backyard BBQs, bikes, basketball, and more. Just minutes to Cricket Field, Eliot School, and commuter routes, this is the kind of home where memories are made.
Last Agent to Sell the Property
Berkshire Hathaway HomeServices Commonwealth Real Estate Listed on: 07/10/2025
| Date | Type | Sale Price | Title Company |
|---|---|---|---|
| Quit Claim Deed | $1,395,000 | -- | |
| Deed | $630,000 | -- | |
| Deed | $630,000 | -- | |
| Deed | $630,000 | -- | |
| Deed | -- | -- | |
| Deed | -- | -- | |
| Deed | -- | -- |
| Date | Status | Loan Amount | Loan Type |
|---|---|---|---|
| Open | $595,000 | New Conventional | |
| Previous Owner | $47,000 | No Value Available | |
| Previous Owner | $400,000 | No Value Available |
| Date | Event | Price | List to Sale | Price per Sq Ft |
|---|---|---|---|---|
| 08/25/2025 08/25/25 | Sold | $1,395,000 | +1.5% | $611 / Sq Ft |
| 07/13/2025 07/13/25 | Pending | -- | -- | -- |
| 07/10/2025 07/10/25 | For Sale | $1,375,000 | -- | $602 / Sq Ft |
| Year | Tax Paid | Tax Assessment Tax Assessment Total Assessment is a certain percentage of the fair market value that is determined by local assessors to be the total taxable value of land and additions on the property. | Land | Improvement |
|---|---|---|---|---|
| 2025 | $11,921 | $1,124,600 | $761,000 | $363,600 |
| 2024 | $11,100 | $886,600 | $491,900 | $394,700 |
| 2023 | $11,107 | $851,800 | $491,900 | $359,900 |
| 2022 | $10,550 | $789,100 | $440,400 | $348,700 |
| 2021 | $10,282 | $789,100 | $440,400 | $348,700 |
| 2020 | $9,835 | $787,400 | $440,400 | $347,000 |
| 2019 | $9,213 | $743,600 | $401,400 | $342,200 |
| 2018 | $8,834 | $743,600 | $401,400 | $342,200 |
| 2017 | $8,289 | $697,100 | $401,400 | $295,700 |
| 2016 | $8,045 | $697,100 | $401,400 | $295,700 |
| 2015 | $7,870 | $697,100 | $401,400 | $295,700 |
| 2014 | $7,265 | $624,100 | $336,400 | $287,700 |
Seller's Agent in 2025
Alison Borrelli
Berkshire Hathaway HomeServices Commonwealth Real Estate
(617) 257-3012
54 in this area
93 Total Sales
J
Buyer's Agent in 2025
Jenny Chang
HyRoad Realty, LLC
(978) 394-2128
1 in this area
12 Total Sales
Source: MLS Property Information Network (MLS PIN)
MLS Number: 73402703
APN: NEED-000093-000009
Disclaimer: Certain information contained herein is derived from information provided by parties other than Homes.com. All information provided is deemed reliable, but is not guaranteed to be accurate and should be independently verified.
![]() The property listing data and information, or the Images, set forth herein were provided to MLS Property Information Network, Inc. from third party sources, including sellers, lessors and public records, and were compiled by MLS Property Information Network, Inc. The property listing data and information, and the Images, are for the personal, non-commercial use of consumers having a good faith interest in purchasing or leasing listed properties of the type displayed to them and may not be used for any purpose other than to identify prospective properties which such consumers may have a good faith interest in purchasing or leasing. MLS Property Information Network, Inc. and its subscribers disclaim any and all representations and warranties as to the accuracy of the property listing data and information, or as to the accuracy of any of the Images, set forth herein.
The property listing data and information, or the Images, set forth herein were provided to MLS Property Information Network, Inc. from third party sources, including sellers, lessors and public records, and were compiled by MLS Property Information Network, Inc. The property listing data and information, and the Images, are for the personal, non-commercial use of consumers having a good faith interest in purchasing or leasing listed properties of the type displayed to them and may not be used for any purpose other than to identify prospective properties which such consumers may have a good faith interest in purchasing or leasing. MLS Property Information Network, Inc. and its subscribers disclaim any and all representations and warranties as to the accuracy of the property listing data and information, or as to the accuracy of any of the Images, set forth herein.
Ask me questions while you tour the home.