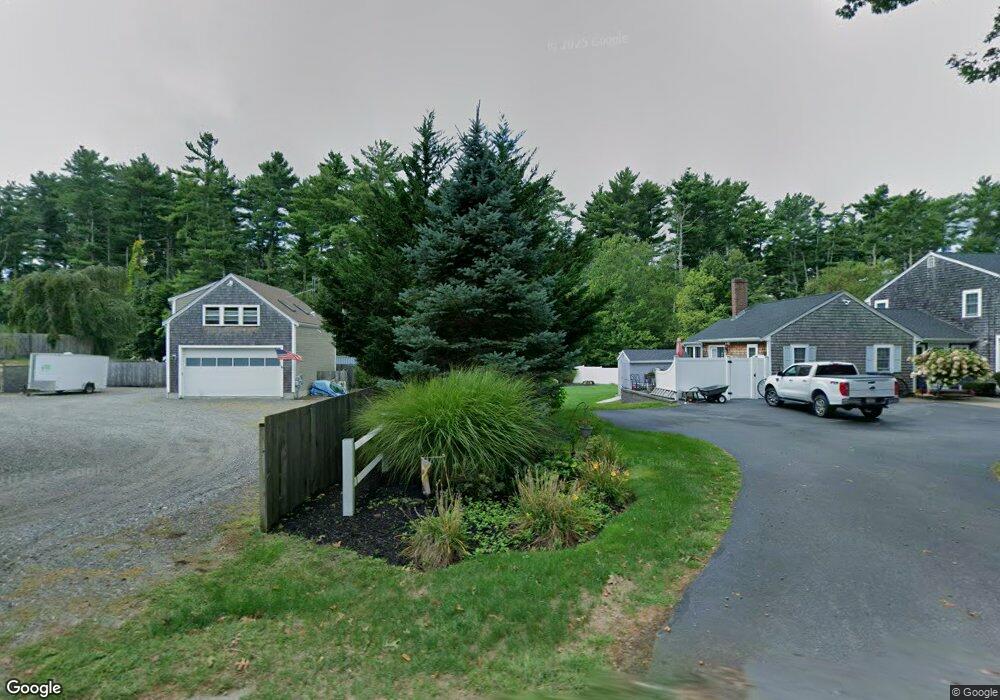
16 Gate St Carver, MA 02330
Estimated Value: $665,000 - $762,143
3
Beds
3
Baths
1,880
Sq Ft
$377/Sq Ft
Est. Value
About This Home
This home is located at 16 Gate St, Carver, MA 02330 and is currently estimated at $709,286, approximately $377 per square foot. 16 Gate St is a home located in Plymouth County with nearby schools including Carver Elementary School and Carver Middle/High School.
Ownership History
Date
Name
Owned For
Owner Type
Purchase Details
Closed on
Dec 21, 2020
Sold by
Poirier Michael F and Poirier Cherie J
Bought by
Poirier Cherie J
Current Estimated Value
Purchase Details
Closed on
Jan 5, 2005
Sold by
Poirier Michael F and Poirier Cherie J
Bought by
Poirier Michael F
Home Financials for this Owner
Home Financials are based on the most recent Mortgage that was taken out on this home.
Original Mortgage
$230,000
Interest Rate
5.75%
Mortgage Type
Purchase Money Mortgage
Create a Home Valuation Report for This Property
The Home Valuation Report is an in-depth analysis detailing your home's value as well as a comparison with similar homes in the area
Home Values in the Area
Average Home Value in this Area
Purchase History
| Date | Buyer | Sale Price | Title Company |
|---|---|---|---|
| Poirier Cherie J | -- | None Available | |
| Poirier Michael F | -- | -- |
Source: Public Records
Mortgage History
| Date | Status | Borrower | Loan Amount |
|---|---|---|---|
| Previous Owner | Poirier Michael F | $230,000 | |
| Previous Owner | Poirier Michael F | $190,000 | |
| Previous Owner | Poirier Michael F | $167,250 | |
| Previous Owner | Poirier Michael F | $125,000 |
Source: Public Records
Tax History
| Year | Tax Paid | Tax Assessment Tax Assessment Total Assessment is a certain percentage of the fair market value that is determined by local assessors to be the total taxable value of land and additions on the property. | Land | Improvement |
|---|---|---|---|---|
| 2025 | $9,685 | $698,300 | $180,700 | $517,600 |
| 2024 | $9,184 | $648,100 | $177,100 | $471,000 |
| 2023 | $8,808 | $603,700 | $177,100 | $426,600 |
| 2022 | $8,390 | $525,000 | $151,500 | $373,500 |
| 2021 | $8,245 | $486,700 | $135,400 | $351,300 |
| 2020 | $7,919 | $460,700 | $126,400 | $334,300 |
| 2019 | $7,372 | $432,400 | $122,700 | $309,700 |
| 2018 | $6,983 | $404,900 | $122,700 | $282,200 |
| 2017 | $6,588 | $372,400 | $118,100 | $254,300 |
| 2016 | $6,110 | $358,800 | $112,500 | $246,300 |
| 2015 | $5,928 | $348,500 | $112,500 | $236,000 |
| 2014 | $5,789 | $340,300 | $142,100 | $198,200 |
Source: Public Records
Map
Nearby Homes
Your Personal Tour Guide
Ask me questions while you tour the home.