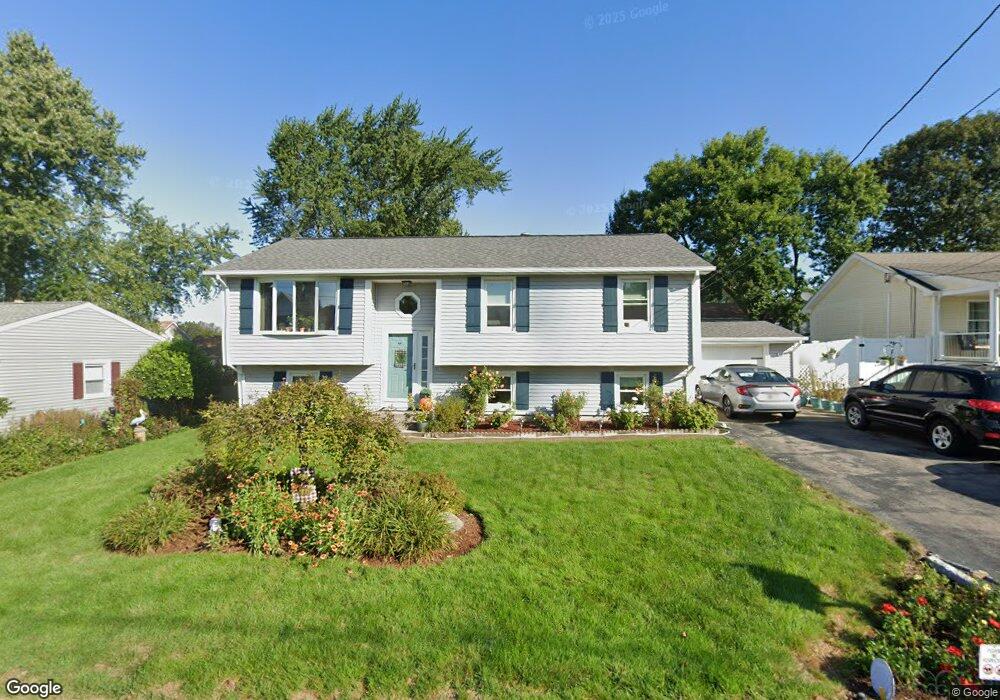
16 Grant St West Warwick, RI 02893
Centreville NeighborhoodEstimated Value: $435,000 - $498,668
4
Beds
3
Baths
2,100
Sq Ft
$222/Sq Ft
Est. Value
About This Home
This home is located at 16 Grant St, West Warwick, RI 02893 and is currently estimated at $467,167, approximately $222 per square foot. 16 Grant St is a home located in Kent County with nearby schools including West Warwick High School.
Ownership History
Date
Name
Owned For
Owner Type
Purchase Details
Closed on
Jun 10, 2020
Sold by
Driven Llc
Bought by
Davis Jonathan
Current Estimated Value
Home Financials for this Owner
Home Financials are based on the most recent Mortgage that was taken out on this home.
Original Mortgage
$365,000
Outstanding Balance
$322,935
Interest Rate
3.1%
Mortgage Type
Stand Alone Refi Refinance Of Original Loan
Estimated Equity
$144,232
Purchase Details
Closed on
Jul 19, 1999
Sold by
Rego Norberto L and Caires Judith J
Bought by
Lapinsky Edward J and Gray Barbara M
Home Financials for this Owner
Home Financials are based on the most recent Mortgage that was taken out on this home.
Original Mortgage
$40,000
Interest Rate
7.39%
Purchase Details
Closed on
Sep 9, 1998
Sold by
Maglioli Anthony and Maglioli Ivana
Bought by
Rego Norberto L and Caires Judith J
Create a Home Valuation Report for This Property
The Home Valuation Report is an in-depth analysis detailing your home's value as well as a comparison with similar homes in the area
Home Values in the Area
Average Home Value in this Area
Purchase History
| Date | Buyer | Sale Price | Title Company |
|---|---|---|---|
| Davis Jonathan | $365,000 | None Available | |
| Lapinsky Edward J | $119,000 | -- | |
| Rego Norberto L | $108,500 | -- |
Source: Public Records
Mortgage History
| Date | Status | Borrower | Loan Amount |
|---|---|---|---|
| Open | Davis Jonathan | $365,000 | |
| Previous Owner | Rego Norberto L | $20,000 | |
| Previous Owner | Rego Norberto L | $60,000 | |
| Previous Owner | Rego Norberto L | $20,000 | |
| Previous Owner | Rego Norberto L | $40,000 |
Source: Public Records
Tax History
| Year | Tax Paid | Tax Assessment Tax Assessment Total Assessment is a certain percentage of the fair market value that is determined by local assessors to be the total taxable value of land and additions on the property. | Land | Improvement |
|---|---|---|---|---|
| 2025 | $6,073 | $425,000 | $110,300 | $314,700 |
| 2024 | $5,846 | $312,800 | $73,900 | $238,900 |
| 2023 | $5,730 | $312,800 | $73,900 | $238,900 |
| 2022 | $5,643 | $312,800 | $73,900 | $238,900 |
| 2021 | $5,720 | $248,700 | $61,600 | $187,100 |
| 2020 | $5,720 | $248,700 | $61,600 | $187,100 |
| 2019 | $7,292 | $248,700 | $61,600 | $187,100 |
| 2018 | $5,175 | $190,400 | $64,000 | $126,400 |
| 2017 | $5,009 | $190,400 | $64,000 | $126,400 |
| 2016 | $4,920 | $190,400 | $64,000 | $126,400 |
| 2015 | $4,753 | $183,100 | $64,000 | $119,100 |
| 2014 | $4,649 | $183,100 | $64,000 | $119,100 |
Source: Public Records
Map
Nearby Homes
- 17 Bellaire Ave
- 165 Lockwood St
- 8 Lenox Ave
- 240 Coit Ave
- 21 Carlson Cir
- 2 Fairgreen Dr
- 37 Gerald St
- 3 June Ct
- 1588 Main St Unit 25
- 2 Duke St Unit D
- 35 Shady Hill Dr
- 6 Teresa Ann Crossing
- 2 Teresa Ann Crossing
- 8 Teresa Ann Crossing
- 4 Teresa Ann Crossing
- 36 Cowesett Ave Unit 5
- 152 Brookside Ave
- 52 Earl St
- 0 Centerville Rd
- 25 Eddy St
Your Personal Tour Guide
Ask me questions while you tour the home.