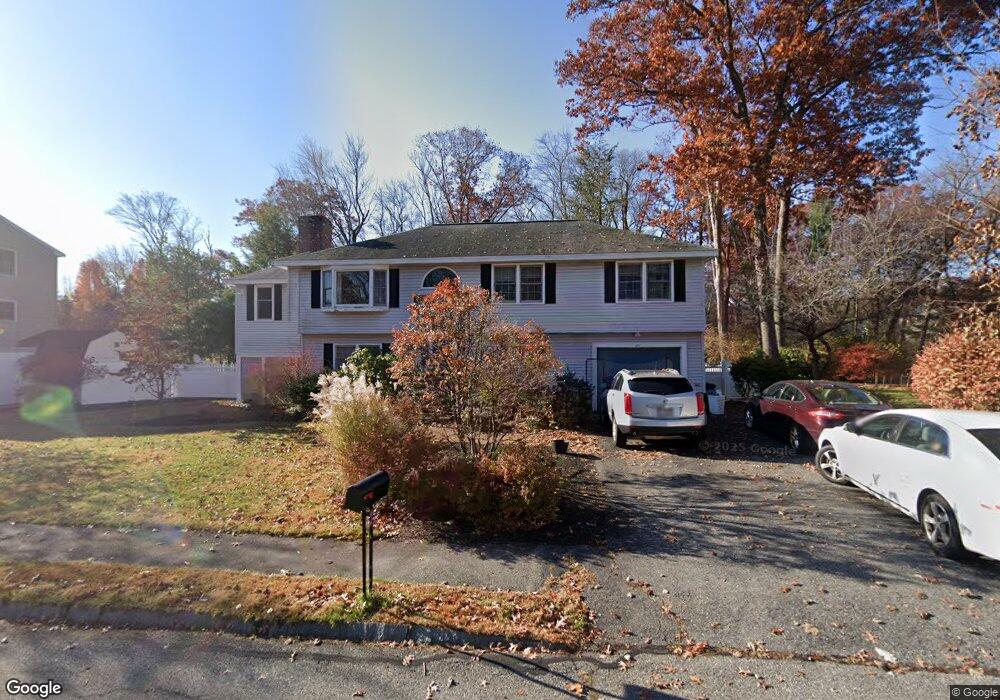
16 Grant St Woburn, MA 01801
Cummingsville NeighborhoodEstimated Value: $790,000 - $994,000
4
Beds
2
Baths
1,825
Sq Ft
$515/Sq Ft
Est. Value
About This Home
This home is located at 16 Grant St, Woburn, MA 01801 and is currently estimated at $940,234, approximately $515 per square foot. 16 Grant St is a home located in Middlesex County with nearby schools including Reeves Elementary School, Daniel L. Joyce Middle School, and Woburn High School.
Ownership History
Date
Name
Owned For
Owner Type
Purchase Details
Closed on
Nov 19, 2020
Sold by
Curtis Carolyn M
Bought by
Curtis Michael S and Curtis Gizele P
Current Estimated Value
Home Financials for this Owner
Home Financials are based on the most recent Mortgage that was taken out on this home.
Original Mortgage
$309,400
Outstanding Balance
$275,322
Interest Rate
2.8%
Mortgage Type
New Conventional
Estimated Equity
$664,912
Purchase Details
Closed on
Oct 6, 2005
Sold by
Levey Bryan O and Levey Lisa A
Bought by
Curtis Brian J and Curtis Carolyn M
Home Financials for this Owner
Home Financials are based on the most recent Mortgage that was taken out on this home.
Original Mortgage
$278,000
Interest Rate
5.81%
Mortgage Type
Purchase Money Mortgage
Purchase Details
Closed on
Apr 8, 1993
Sold by
Pine Tree Rt and Murray
Bought by
Levey Bryan O and Levey Lisa A
Create a Home Valuation Report for This Property
The Home Valuation Report is an in-depth analysis detailing your home's value as well as a comparison with similar homes in the area
Home Values in the Area
Average Home Value in this Area
Purchase History
| Date | Buyer | Sale Price | Title Company |
|---|---|---|---|
| Curtis Michael S | $442,000 | None Available | |
| Curtis Brian J | $535,150 | -- | |
| Curtis Brian J | $535,150 | -- | |
| Levey Bryan O | $183,000 | -- |
Source: Public Records
Mortgage History
| Date | Status | Borrower | Loan Amount |
|---|---|---|---|
| Open | Curtis Michael S | $309,400 | |
| Previous Owner | Levey Bryan O | $175,000 | |
| Previous Owner | Curtis Brian J | $278,000 | |
| Previous Owner | Levey Bryan O | $128,000 |
Source: Public Records
Tax History Compared to Growth
Tax History
| Year | Tax Paid | Tax Assessment Tax Assessment Total Assessment is a certain percentage of the fair market value that is determined by local assessors to be the total taxable value of land and additions on the property. | Land | Improvement |
|---|---|---|---|---|
| 2025 | $7,699 | $901,500 | $418,900 | $482,600 |
| 2024 | $7,148 | $886,800 | $399,000 | $487,800 |
| 2023 | $6,911 | $794,400 | $362,800 | $431,600 |
| 2022 | $6,664 | $713,500 | $315,600 | $397,900 |
| 2021 | $6,370 | $682,700 | $300,600 | $382,100 |
| 2020 | $6,133 | $658,000 | $300,600 | $357,400 |
| 2019 | $5,832 | $613,900 | $286,300 | $327,600 |
| 2018 | $5,693 | $575,600 | $273,200 | $302,400 |
| 2017 | $5,479 | $551,200 | $260,300 | $290,900 |
| 2016 | $5,230 | $520,400 | $243,300 | $277,100 |
| 2015 | $5,037 | $495,300 | $227,400 | $267,900 |
| 2014 | $4,993 | $478,300 | $244,800 | $233,500 |
Source: Public Records
Map
Nearby Homes
- 23 Thoreau Rd
- 23 Burroughs Rd
- 49 Duren Ave
- 162 North St
- 1 Maureen Rd
- 6 Maureen Rd
- 14 Liana St
- 2 Howard Ct
- 92 Muller Rd
- 3 Brown Rd
- 14 Saw Mill Brook Way
- 71 Webb St
- 500 Lexington St Unit 6
- 15 Peachtree Rd
- 21 Derby Dr Unit 21
- 15 Crescent Rd
- 36 Adams St
- 197 Woburn St
- 16 Winning Farm Rd Unit 16
- 12 Coolidge Ave