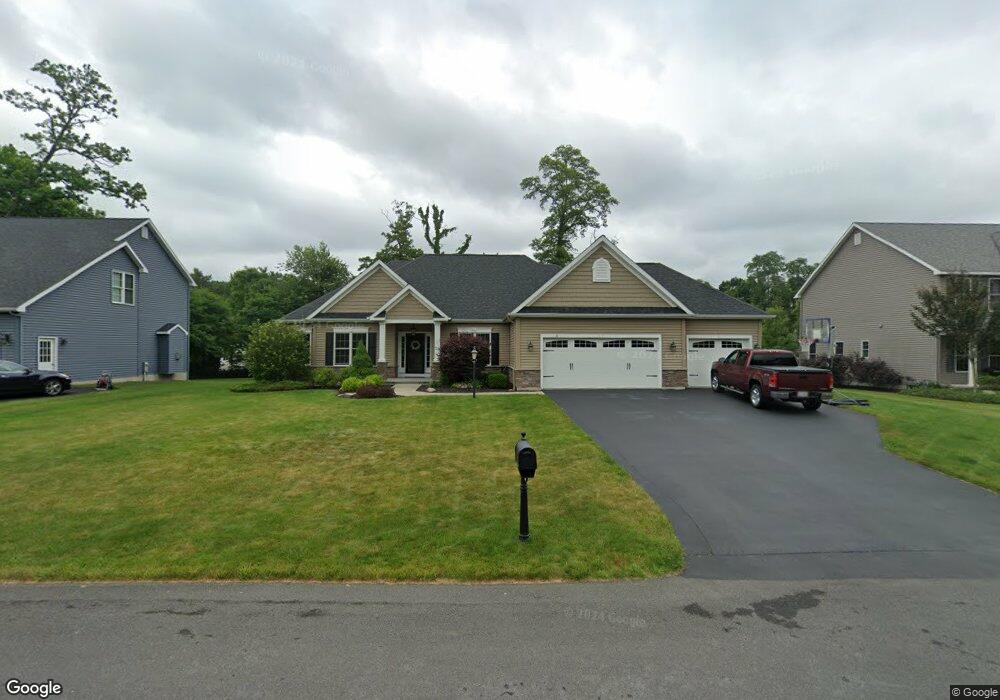
16 Haawk Ct Delmar, NY 12054
Estimated Value: $606,000 - $699,000
2
Beds
3
Baths
2,068
Sq Ft
$324/Sq Ft
Est. Value
About This Home
This home is located at 16 Haawk Ct, Delmar, NY 12054 and is currently estimated at $669,858, approximately $323 per square foot. 16 Haawk Ct is a home with nearby schools including St. Thomas the Apostle School and Mt. Moriah Academy.
Ownership History
Date
Name
Owned For
Owner Type
Purchase Details
Closed on
May 22, 2014
Sold by
Charlew Builders Inc
Bought by
Filarecki Brian and Filarecki Jessica
Current Estimated Value
Home Financials for this Owner
Home Financials are based on the most recent Mortgage that was taken out on this home.
Original Mortgage
$370,000
Interest Rate
4.33%
Mortgage Type
Purchase Money Mortgage
Purchase Details
Closed on
Oct 29, 2010
Sold by
Klein Susan A
Bought by
Klein Peter W
Create a Home Valuation Report for This Property
The Home Valuation Report is an in-depth analysis detailing your home's value as well as a comparison with similar homes in the area
Home Values in the Area
Average Home Value in this Area
Purchase History
| Date | Buyer | Sale Price | Title Company |
|---|---|---|---|
| Filarecki Brian | $450,000 | None Available | |
| Klein Peter W | -- | None Available |
Source: Public Records
Mortgage History
| Date | Status | Borrower | Loan Amount |
|---|---|---|---|
| Previous Owner | Filarecki Brian | $370,000 |
Source: Public Records
Tax History
| Year | Tax Paid | Tax Assessment Tax Assessment Total Assessment is a certain percentage of the fair market value that is determined by local assessors to be the total taxable value of land and additions on the property. | Land | Improvement |
|---|---|---|---|---|
| 2025 | $14,721 | $463,000 | $17,532 | $445,468 |
| 2024 | $14,721 | $463,000 | $17,532 | $445,468 |
| 2023 | $14,271 | $463,000 | $17,532 | $445,468 |
| 2022 | $13,923 | $463,000 | $17,532 | $445,468 |
| 2021 | $14,011 | $463,000 | $17,532 | $445,468 |
| 2020 | $13,929 | $463,000 | $17,532 | $445,468 |
| 2019 | $12,603 | $463,000 | $17,532 | $445,468 |
| 2018 | $13,659 | $463,000 | $17,532 | $445,468 |
| 2017 | $13,004 | $450,000 | $76,000 | $374,000 |
| 2016 | $13,004 | $450,000 | $76,000 | $374,000 |
| 2015 | -- | $450,000 | $76,000 | $374,000 |
| 2014 | -- | $68,000 | $68,000 | $0 |
Source: Public Records
Map
Nearby Homes
- 6 Flint Dr
- 23 Woodmont Dr
- 667 Feura Bush Rd
- 642 Feura Bush Rd
- 60 Fernbank Ave
- 17 Camden Cir
- 44 Kendall Dr
- 8 Wedge Rd
- 8 Sherbrook Dr
- 33 Harwick Dr
- 51 Peel St
- 27 Wexford Rd
- 102 Brightonwood Rd
- 39 Constitution Dr
- 5 York Rd
- 36 Ellendale Ave
- 43 Harrison Ave
- 41 Commonwealth Dr
- 48 Commonwealth Dr
- 234 (Parcel 2) Bender Ln
Your Personal Tour Guide
Ask me questions while you tour the home.