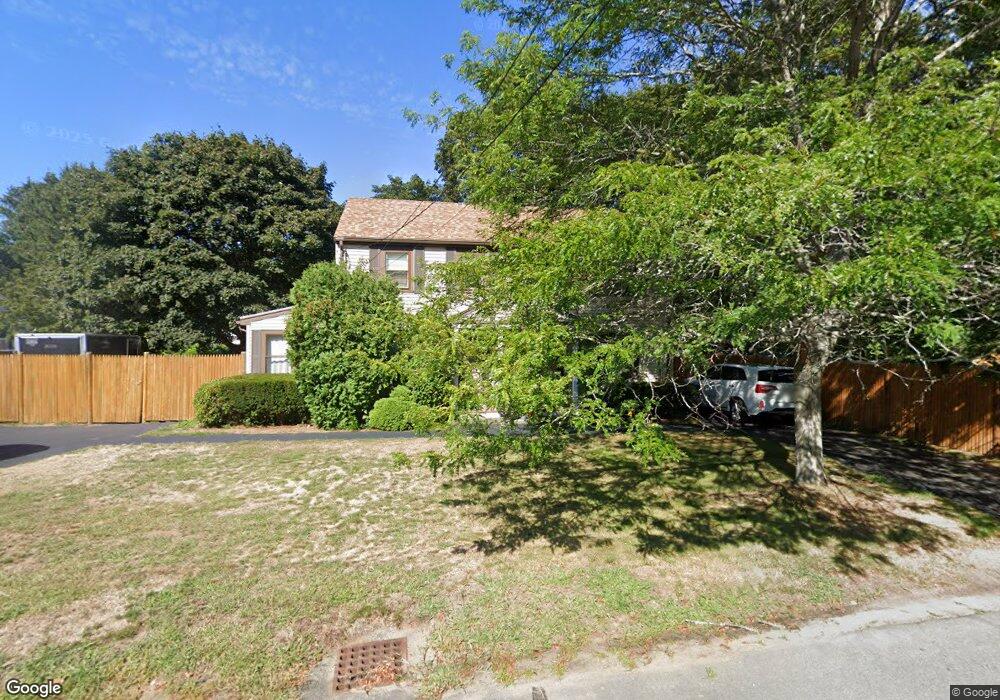
16 Hemlock Rd Hingham, MA 02043
Estimated Value: $681,803 - $1,009,000
3
Beds
1
Bath
910
Sq Ft
$936/Sq Ft
Est. Value
About This Home
This home is located at 16 Hemlock Rd, Hingham, MA 02043 and is currently estimated at $851,701, approximately $935 per square foot. 16 Hemlock Rd is a home located in Plymouth County with nearby schools including Plymouth River Elementary School, Hingham Middle School, and Hingham High School.
Ownership History
Date
Name
Owned For
Owner Type
Purchase Details
Closed on
Nov 3, 2015
Sold by
Nee Martin S and Nee Ramona J
Bought by
Nee Martin S
Current Estimated Value
Purchase Details
Closed on
Oct 23, 2009
Sold by
Irma Wells Rt and Wells Christopher F
Bought by
Nee Martin S and Nee Ramona J
Home Financials for this Owner
Home Financials are based on the most recent Mortgage that was taken out on this home.
Original Mortgage
$275,625
Interest Rate
5.09%
Mortgage Type
Purchase Money Mortgage
Create a Home Valuation Report for This Property
The Home Valuation Report is an in-depth analysis detailing your home's value as well as a comparison with similar homes in the area
Purchase History
| Date | Buyer | Sale Price | Title Company |
|---|---|---|---|
| Nee Martin S | -- | -- | |
| Nee Martin S | $367,500 | -- |
Source: Public Records
Mortgage History
| Date | Status | Borrower | Loan Amount |
|---|---|---|---|
| Previous Owner | Nee Martin S | $275,625 |
Source: Public Records
Tax History
| Year | Tax Paid | Tax Assessment Tax Assessment Total Assessment is a certain percentage of the fair market value that is determined by local assessors to be the total taxable value of land and additions on the property. | Land | Improvement |
|---|---|---|---|---|
| 2025 | $6,247 | $584,400 | $320,000 | $264,400 |
| 2024 | $6,341 | $584,400 | $320,000 | $264,400 |
| 2023 | $5,150 | $515,000 | $297,200 | $217,800 |
| 2022 | $5,415 | $468,400 | $259,100 | $209,300 |
| 2021 | $5,337 | $452,300 | $259,100 | $193,200 |
| 2020 | $5,215 | $452,300 | $259,100 | $193,200 |
| 2019 | $4,946 | $418,800 | $259,100 | $159,700 |
| 2018 | $4,633 | $393,600 | $259,100 | $134,500 |
| 2017 | $4,659 | $380,300 | $255,900 | $124,400 |
| 2016 | $4,656 | $372,800 | $243,700 | $129,100 |
| 2015 | $4,161 | $332,100 | $215,600 | $116,500 |
Source: Public Records
Map
Nearby Homes
- 1 Hemlock Rd
- 2 Black Rock Dr Unit 21
- 2 Black Rock Dr
- 6 Brewer Way
- 156 Fort Hill St
- 1297 Pleasant St
- 428 Main St
- 168 Stayner Dr Unit 168
- 7 Lewis Ct
- 43 Filomena St
- 5 Old County Rd
- 425 East St
- 14 Cross St
- 32-70 Lazell St
- 5 Endicott St
- 32 Lazell St
- 6 Adams Ct
- 30 Puritan Rd
- 14 Old Stone Way Unit 11
- 70 Lazell St
- 18 Hemlock Rd
- 1 Nutty Hill Rd
- 20 Hemlock Rd
- 4-6 Nutty Hill Rd Unit 6
- 4-6 Nutty Hill Rd
- 14 Hemlock Rd
- 5 Nutty Hill Rd
- 2 Nutty Hill Rd
- 9 Hemlock Rd
- 4 Nutty Hill Rd
- 4 Nutty Hill Rd Unit 6
- 4 Nutty Hill Rd Unit 4
- 4 Nutty Hill Rd
- 13 Hemlock Rd
- 6 Nutty Hill Rd Unit 6
- 7 Hemlock Rd 21 Whitehorse Rd
- 7 Hemlock Rd
- 7 Hemlock Rd Unit 1
- 15 Hemlock Rd
- 15 Hemlock Rd Unit House
Your Personal Tour Guide
Ask me questions while you tour the home.