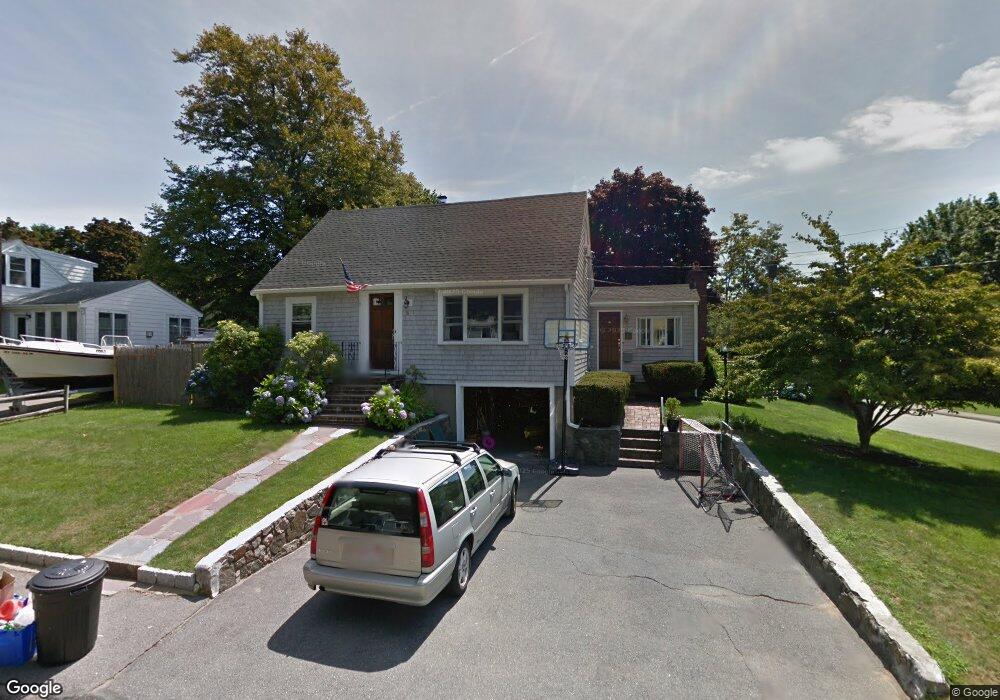
16 Hibbard Rd Marblehead, MA 01945
Estimated Value: $751,714 - $962,000
3
Beds
3
Baths
1,728
Sq Ft
$507/Sq Ft
Est. Value
About This Home
This home is located at 16 Hibbard Rd, Marblehead, MA 01945 and is currently estimated at $875,429, approximately $506 per square foot. 16 Hibbard Rd is a home located in Essex County with nearby schools including Marblehead High School, Marblehead Community Charter Public School, and Tower School.
Ownership History
Date
Name
Owned For
Owner Type
Purchase Details
Closed on
Jul 1, 2003
Sold by
Haritos Charles J
Bought by
Sheridan Timothy C and Sheridan Susan E
Current Estimated Value
Home Financials for this Owner
Home Financials are based on the most recent Mortgage that was taken out on this home.
Original Mortgage
$322,700
Interest Rate
5.53%
Mortgage Type
Purchase Money Mortgage
Create a Home Valuation Report for This Property
The Home Valuation Report is an in-depth analysis detailing your home's value as well as a comparison with similar homes in the area
Home Values in the Area
Average Home Value in this Area
Purchase History
| Date | Buyer | Sale Price | Title Company |
|---|---|---|---|
| Sheridan Timothy C | $407,000 | -- |
Source: Public Records
Mortgage History
| Date | Status | Borrower | Loan Amount |
|---|---|---|---|
| Open | Sheridan Timothy C | $397,500 | |
| Closed | Sheridan Timothy C | $322,700 | |
| Closed | Sheridan Timothy C | $40,700 |
Source: Public Records
Tax History
| Year | Tax Paid | Tax Assessment Tax Assessment Total Assessment is a certain percentage of the fair market value that is determined by local assessors to be the total taxable value of land and additions on the property. | Land | Improvement |
|---|---|---|---|---|
| 2025 | $6,416 | $709,000 | $496,100 | $212,900 |
| 2024 | $6,015 | $671,300 | $533,300 | $138,000 |
| 2023 | $6,179 | $617,900 | $465,100 | $152,800 |
| 2022 | $5,899 | $560,700 | $409,300 | $151,400 |
| 2021 | $5,713 | $548,300 | $396,900 | $151,400 |
| 2020 | $5,343 | $514,200 | $384,500 | $129,700 |
| 2019 | $5,241 | $488,000 | $359,700 | $128,300 |
| 2018 | $5,241 | $475,600 | $347,300 | $128,300 |
| 2017 | $4,827 | $438,400 | $310,100 | $128,300 |
| 2016 | $4,594 | $413,900 | $285,300 | $128,600 |
| 2015 | $4,357 | $393,200 | $272,900 | $120,300 |
| 2014 | $3,917 | $353,200 | $235,700 | $117,500 |
Source: Public Records
Map
Nearby Homes
- 69 Kenneth Rd
- 16 Liberty Rd
- 4 Broadmere Way
- 26 Bayview Rd
- 78 Bayview Rd
- 197A W Shore Dr Unit A
- 132 - 134 Elm St Unit 132
- 149 Elm St
- 6 Mount Vernon St
- 45 Pleasant St
- 72 Village St
- 2 Girdler Rd
- 8 Franklin St Unit 19
- 126 Pleasant St
- 9 Darling St
- 12 Darling St Unit 2
- 290 Washington St Unit 2
- 7 Lee St Unit 1
- 4 Winter Island Rd
- 5 Winter Island Rd
Your Personal Tour Guide
Ask me questions while you tour the home.