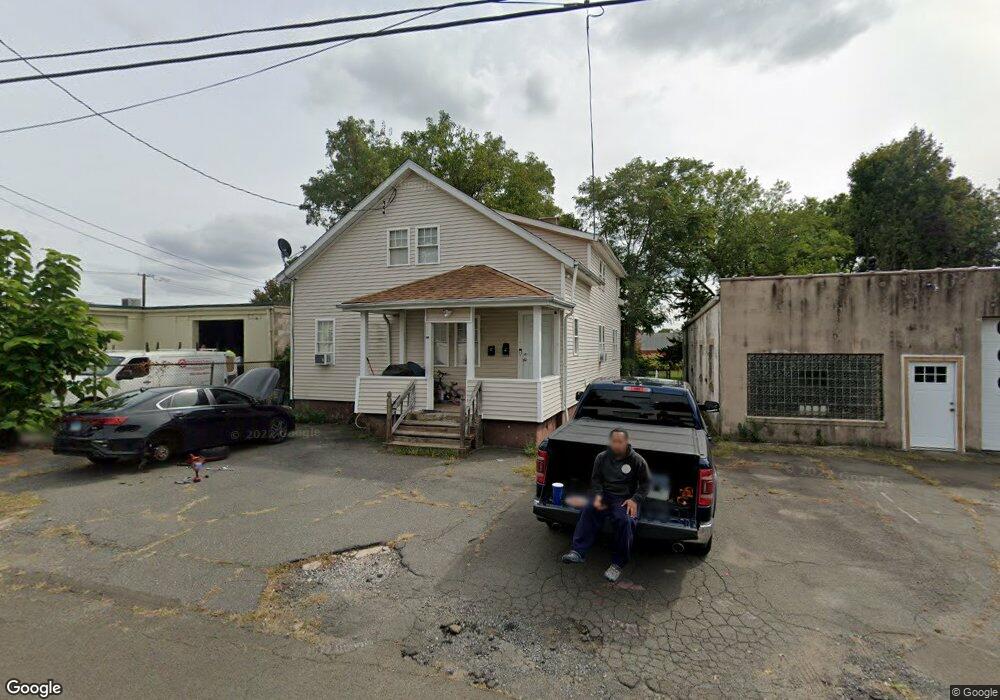
16 High St West Haven, CT 06516
Allingtown NeighborhoodEstimated Value: $347,035 - $454,000
4
Beds
2
Baths
1,940
Sq Ft
$217/Sq Ft
Est. Value
About This Home
This home is located at 16 High St, West Haven, CT 06516 and is currently estimated at $420,759, approximately $216 per square foot. 16 High St is a home located in New Haven County with nearby schools including Carrigan 5/6 Intermediate School, Harry M. Bailey Middle School, and West Haven High School.
Ownership History
Date
Name
Owned For
Owner Type
Purchase Details
Closed on
Dec 7, 2011
Sold by
Us Bank Na and Structured Asset Inves
Bought by
Mateo Carlos
Current Estimated Value
Purchase Details
Closed on
Nov 17, 2010
Sold by
Sanchez Jesus P
Bought by
Us Bank Na
Purchase Details
Closed on
Nov 2, 1998
Sold by
Winslow Don J and Winslow Elaine
Bought by
Milano Elizabeth and Sanchez Jesus
Home Financials for this Owner
Home Financials are based on the most recent Mortgage that was taken out on this home.
Original Mortgage
$85,400
Interest Rate
6.68%
Mortgage Type
Purchase Money Mortgage
Create a Home Valuation Report for This Property
The Home Valuation Report is an in-depth analysis detailing your home's value as well as a comparison with similar homes in the area
Home Values in the Area
Average Home Value in this Area
Purchase History
| Date | Buyer | Sale Price | Title Company |
|---|---|---|---|
| Mateo Carlos | $53,000 | -- | |
| Mateo Carlos | $53,000 | -- | |
| Us Bank Na | -- | -- | |
| Us Bank Na | -- | -- | |
| Milano Elizabeth | $87,900 | -- | |
| Milano Elizabeth | $87,900 | -- |
Source: Public Records
Mortgage History
| Date | Status | Borrower | Loan Amount |
|---|---|---|---|
| Previous Owner | Milano Elizabeth | $148,750 | |
| Previous Owner | Milano Elizabeth | $85,400 |
Source: Public Records
Tax History
| Year | Tax Paid | Tax Assessment Tax Assessment Total Assessment is a certain percentage of the fair market value that is determined by local assessors to be the total taxable value of land and additions on the property. | Land | Improvement |
|---|---|---|---|---|
| 2025 | $7,640 | $224,630 | $58,590 | $166,040 |
| 2024 | $6,664 | $139,160 | $40,600 | $98,560 |
| 2023 | $6,460 | $139,160 | $40,600 | $98,560 |
| 2022 | $6,347 | $139,160 | $40,600 | $98,560 |
| 2021 | $6,348 | $139,160 | $40,600 | $98,560 |
| 2020 | $5,862 | $113,820 | $32,620 | $81,200 |
| 2019 | $5,771 | $113,820 | $32,620 | $81,200 |
| 2018 | $5,614 | $113,820 | $32,620 | $81,200 |
| 2017 | $5,438 | $113,820 | $32,620 | $81,200 |
| 2016 | $5,273 | $113,820 | $32,620 | $81,200 |
| 2015 | $5,016 | $123,270 | $36,400 | $86,870 |
| 2014 | $4,916 | $123,270 | $36,400 | $86,870 |
Source: Public Records
Map
Nearby Homes
Your Personal Tour Guide
Ask me questions while you tour the home.