Estimated Value: $314,979 - $360,000
3
Beds
2
Baths
1,877
Sq Ft
$180/Sq Ft
Est. Value
About This Home
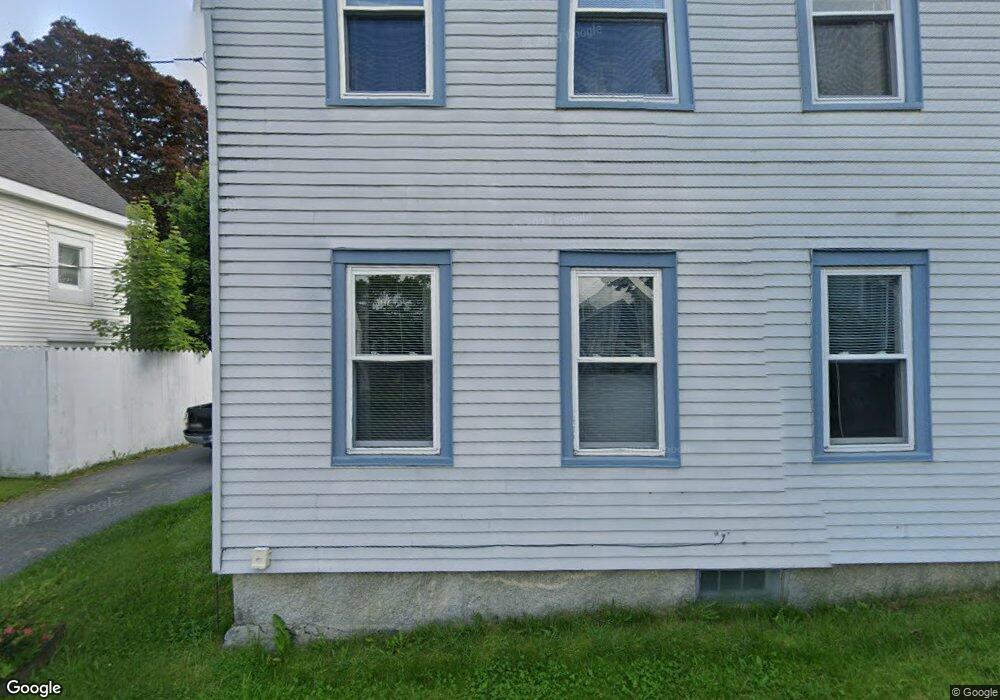
This home is located at 16 Hinckley St, Bath, ME 04530 and is currently estimated at $338,245, approximately $180 per square foot. 16 Hinckley St is a home located in Sagadahoc County with nearby schools including Morse High School and Hyde School.
Ownership History
Date
Name
Owned For
Owner Type
Purchase Details
Closed on
Sep 14, 2009
Sold by
Lowery Norman A and Lowery Donna L
Bought by
Johnson Oleg P
Current Estimated Value
Home Financials for this Owner
Home Financials are based on the most recent Mortgage that was taken out on this home.
Original Mortgage
$126,373
Outstanding Balance
$83,024
Interest Rate
5.36%
Mortgage Type
FHA
Estimated Equity
$255,221
Purchase Details
Closed on
Nov 29, 2005
Sold by
Lowery Norman A
Bought by
Lowery Norman A and Lowery Donna L
Create a Home Valuation Report for This Property
The Home Valuation Report is an in-depth analysis detailing your home's value as well as a comparison with similar homes in the area
Home Values in the Area
Average Home Value in this Area
Purchase History
| Date | Buyer | Sale Price | Title Company |
|---|---|---|---|
| Johnson Oleg P | -- | -- | |
| Lowery Norman A | -- | -- |
Source: Public Records
Mortgage History
| Date | Status | Borrower | Loan Amount |
|---|---|---|---|
| Open | Johnson Oleg P | $126,373 |
Source: Public Records
Tax History
| Year | Tax Paid | Tax Assessment Tax Assessment Total Assessment is a certain percentage of the fair market value that is determined by local assessors to be the total taxable value of land and additions on the property. | Land | Improvement |
|---|---|---|---|---|
| 2025 | $3,780 | $234,800 | $33,900 | $200,900 |
| 2024 | $3,434 | $208,100 | $33,500 | $174,600 |
| 2023 | $3,265 | $193,200 | $30,700 | $162,500 |
| 2022 | $3,062 | $150,100 | $20,100 | $130,000 |
| 2021 | $3,047 | $150,100 | $20,100 | $130,000 |
| 2020 | $3,002 | $150,100 | $20,100 | $130,000 |
| 2019 | $2,972 | $150,100 | $20,100 | $130,000 |
| 2018 | $3,126 | $143,400 | $17,900 | $125,500 |
| 2017 | $3,062 | $143,400 | $17,900 | $125,500 |
| 2016 | $3,026 | $143,400 | $17,900 | $125,500 |
| 2015 | $2,968 | $143,400 | $17,900 | $125,500 |
| 2014 | $2,897 | $143,400 | $17,900 | $125,500 |
| 2013 | $2,816 | $143,400 | $17,900 | $125,500 |
Source: Public Records
Map
Nearby Homes
- 14 Hinckley St
- 9 Pleasant St
- 17 Hinckley St
- 21 Pleasant St
- 24 Hinckley St
- 19 Hinckley St
- 510 Washington St
- 20 Spring St
- 27 Pleasant St
- 25 Hinckley St
- 16 Spring St
- 498 Washington St
- 16 Pleasant St
- 30 Spring St
- 15 Hinckley St
- 33 Hinckley St
- 31 Pleasant St
- 26 Pleasant St
- 36 Hinckley St
- 488 Washington St
Your Personal Tour Guide
Ask me questions while you tour the home.