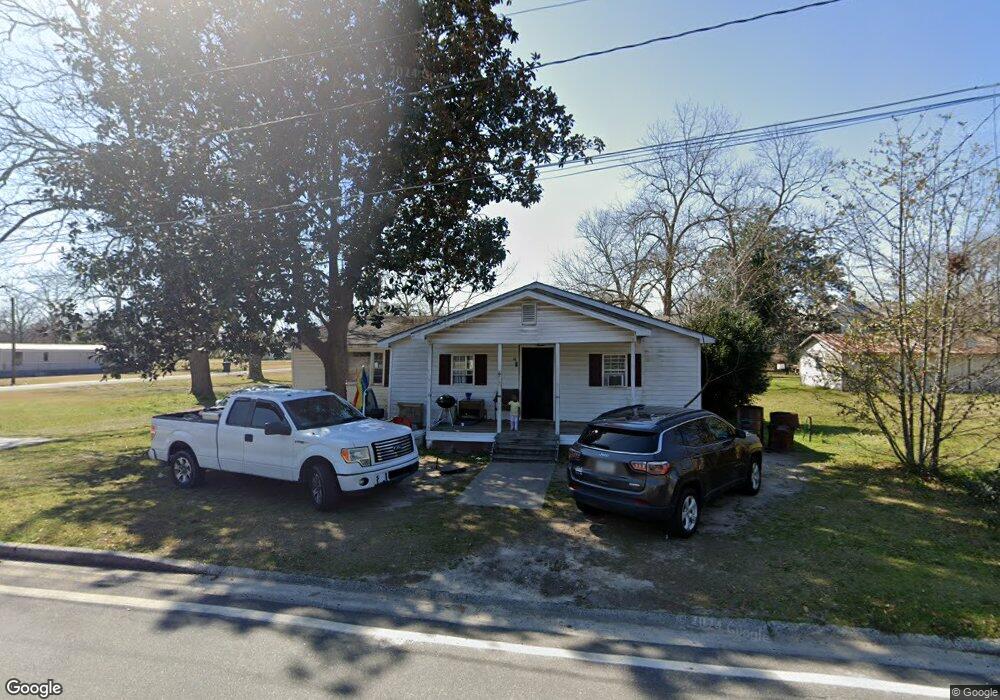
16 Hodges St Claxton, GA 30417
Estimated Value: $118,000 - $188,000
3
Beds
2
Baths
1,756
Sq Ft
$85/Sq Ft
Est. Value
About This Home
This home is located at 16 Hodges St, Claxton, GA 30417 and is currently estimated at $148,416, approximately $84 per square foot. 16 Hodges St is a home located in Evans County with nearby schools including Claxton Elementary School, Claxton Middle School, and Claxton High School.
Ownership History
Date
Name
Owned For
Owner Type
Purchase Details
Closed on
Aug 21, 2019
Sold by
Tippins Bank
Bought by
Jones Charles John
Current Estimated Value
Purchase Details
Closed on
Oct 21, 2016
Sold by
Charles J
Bought by
Gibson Barry Lynn
Purchase Details
Closed on
Aug 31, 2016
Bought by
Jones Charles J
Purchase Details
Closed on
Dec 1, 2015
Sold by
Walker Brandon Taylor
Bought by
Glennville Bank
Purchase Details
Closed on
May 17, 2013
Sold by
Walker Angela Smith
Bought by
Walker Brandon Taylor
Purchase Details
Closed on
Aug 29, 2007
Sold by
Walker Jerry P
Bought by
Smith Lemuel F
Purchase Details
Closed on
Oct 18, 2001
Sold by
Smith Lyle Mrs
Bought by
Walker Jerry P and Walker Ang
Purchase Details
Closed on
Jun 13, 2001
Sold by
Smith Lemuel F
Bought by
Walker Angela L
Purchase Details
Closed on
Jan 1, 1953
Bought by
Smith Lyle Mrs
Create a Home Valuation Report for This Property
The Home Valuation Report is an in-depth analysis detailing your home's value as well as a comparison with similar homes in the area
Home Values in the Area
Average Home Value in this Area
Purchase History
| Date | Buyer | Sale Price | Title Company |
|---|---|---|---|
| Jones Charles John | -- | -- | |
| Gibson Barry Lynn | $29,000 | -- | |
| Jones Charles J | $25,000 | -- | |
| Glennville Bank | $28,000 | -- | |
| Walker Brandon Taylor | $18,029 | -- | |
| Smith Lemuel F | -- | -- | |
| Walker Jerry P | -- | -- | |
| Walker Angela L | -- | -- | |
| Smith Lyle Mrs | -- | -- |
Source: Public Records
Tax History
| Year | Tax Paid | Tax Assessment Tax Assessment Total Assessment is a certain percentage of the fair market value that is determined by local assessors to be the total taxable value of land and additions on the property. | Land | Improvement |
|---|---|---|---|---|
| 2025 | $1,026 | $39,000 | $3,680 | $35,320 |
| 2024 | $671 | $35,880 | $3,680 | $32,200 |
| 2023 | $671 | $18,736 | $3,040 | $15,696 |
| 2022 | $573 | $18,736 | $3,040 | $15,696 |
| 2021 | $681 | $18,736 | $3,040 | $15,696 |
| 2020 | $683 | $18,736 | $3,040 | $15,696 |
| 2019 | $641 | $18,736 | $3,040 | $15,696 |
| 2018 | $582 | $16,776 | $3,040 | $13,736 |
| 2017 | $333 | $18,736 | $3,040 | $15,696 |
| 2016 | $708 | $22,988 | $3,040 | $19,948 |
| 2015 | -- | $26,548 | $3,040 | $23,508 |
| 2014 | -- | $26,548 | $3,040 | $23,508 |
| 2013 | -- | $26,908 | $3,040 | $23,868 |
Source: Public Records
Map
Nearby Homes
- 19 Collins St
- 0 Turnpike Rd Unit SA339603
- 29 Grove Ln
- 0 Dublin Rd
- 437 Burkhalter Cir
- 702 Rosedale Ave
- 606 Park Ave
- 610 W Liberty St
- 606 W Liberty St
- 12 Wisteria Ln
- 12 Wysteria Ln
- 10 Honeysuckle Dr
- 7 Honeysuckle Way
- 1293 Pine Ridge Dr
- 9 Honeysuckle Dr
- 3 Wysteria Ln
- 3 Honeysuckle Dr
- 200 Lex Strickland Rd
- 4909 Perry Rd
- 6 N Spring St
- 12 Hodges St
- 0 Hodges St Unit 160919
- 0 Hodges St Unit 170876
- 0 Hodges St Unit 7156550
- 0 Hodges St Unit 8162314
- 0 Hodges St Unit 8533356
- 118 Cedar Ave
- 61 Hodges St
- 722 S Railroad Ave
- 732 S Railroad Ave
- 109 Cedar Ave
- 210 Cedar Ave
- 105 Cedar Ave
- 5736 Tattnall St
- 201 Cedar Ave
- 102 Cedar Ave
- 0 Collins Unit 10287540
- 101 Cedar Ave
- 706 S Railroad Ave
- 23 Collins
Your Personal Tour Guide
Ask me questions while you tour the home.